November 2026
Spotlight on: Food Assistance and the Poverty Shortfall in New York City
Contributors: Daniel Salgado, Christopher Wimer, Yajun Jia, Schuyler Ross, and Christopher Yera
Issues Areas: Food Hardship
Introduction
Every fall, Robin Hood and researchers at Columbia University’s School of Social Work publish a spotlight report ahead of the Thanksgiving holiday highlighting the latest Poverty Tracker data on food hardship and food assistance in New York City. As families and friends prepare to gather around the proverbial table to share a meal in celebration, many New Yorkers are being challenged by rising food costs, growing affordability challenges, and the reduction of safety net programs, driving New Yorkers to find additional ways to meet their families’ needs.
Using food pantries is one way New Yorkers are meeting these needs. Pantries and other free food providers have always been a key complement to government nutrition programs like SNAP and WIC, but they stand to become even more critical as policymakers make major cuts to the food-based safety net. So who is using the pantry system in New York City, and how much of the poverty shortfall — the degree to which New Yorkers’ incomes fall below the poverty line — does the system fill? And if given more resources, how much more of the poverty shortfall 1 could the pantry system fill if more New Yorkers struggling with food hardship were to access the system? This spotlight report seeks to address these questions.
In this report, we begin by showing current trends in food hardship and food pantry use in the city, updating trends through 2025. We note that trends through 2025 don’t yet fully include many of the major changes to critical economic supports for families and children enacted by Congress in the form of cuts to programs like SNAP and Medicaid. In New York State, as in many states, SNAP enrollment started to decline in the last months of 2025 and has kept falling as of this writing in late 2026. Future changes unfold in stages in the years to come that are expected to further reduce participation. If these cuts play out as enacted, many families will lose access to benefits and some will turn to the pantry system to help fill the gap.
After showing recent trends, we turn to an investigation of food pantry use in the city, based on recent data from 2022 to 2024. We provide a profile of food pantry users in recent years and examine their experiences with hardship and health issues, engagement with the labor market, and the life shocks they contend with. We then proceed to investigate the monetary value of food accessed through the pantry system and examine how those resources stack up against families’ incomes. Analyzing this value through the lens of income poverty reveals how much of the “poverty shortfall” pantry assistance currently fills, and how much more it could fill if additional families utilized it and existing pantry users utilized it more frequently.
Key Findings
- 31% of New Yorkers — more than 2.6 million people — experienced food hardship in 2025. This rate has fluctuated a bit year to year but remains at high levels.
- Approximately 15% of New Yorkers, nearly 1.3 million people, accessed free food from a pantry or other free food provider in 2025, a slightly higher rate than in 2024, when pantry use stood at 14%.
- New Yorkers utilizing the pantry system are a broad cross-section of the city’s population, though older adults, families with children, and groups with elevated poverty rates are more likely to utilize the system.
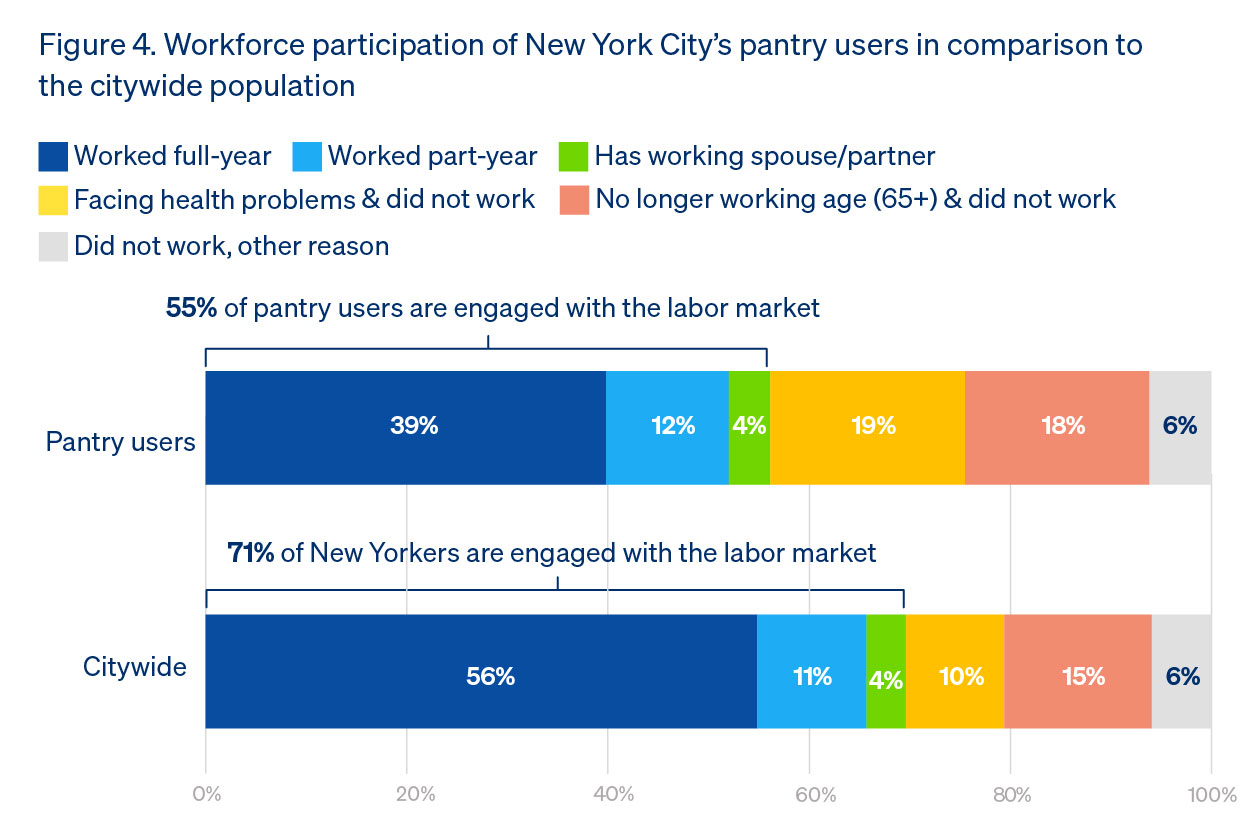
- The majority of New York City’s pantry users (55%) are engaged with the labor market; among those who aren’t, they tend to be older adults of retirement age or adults coping with health challenges and disabilities.
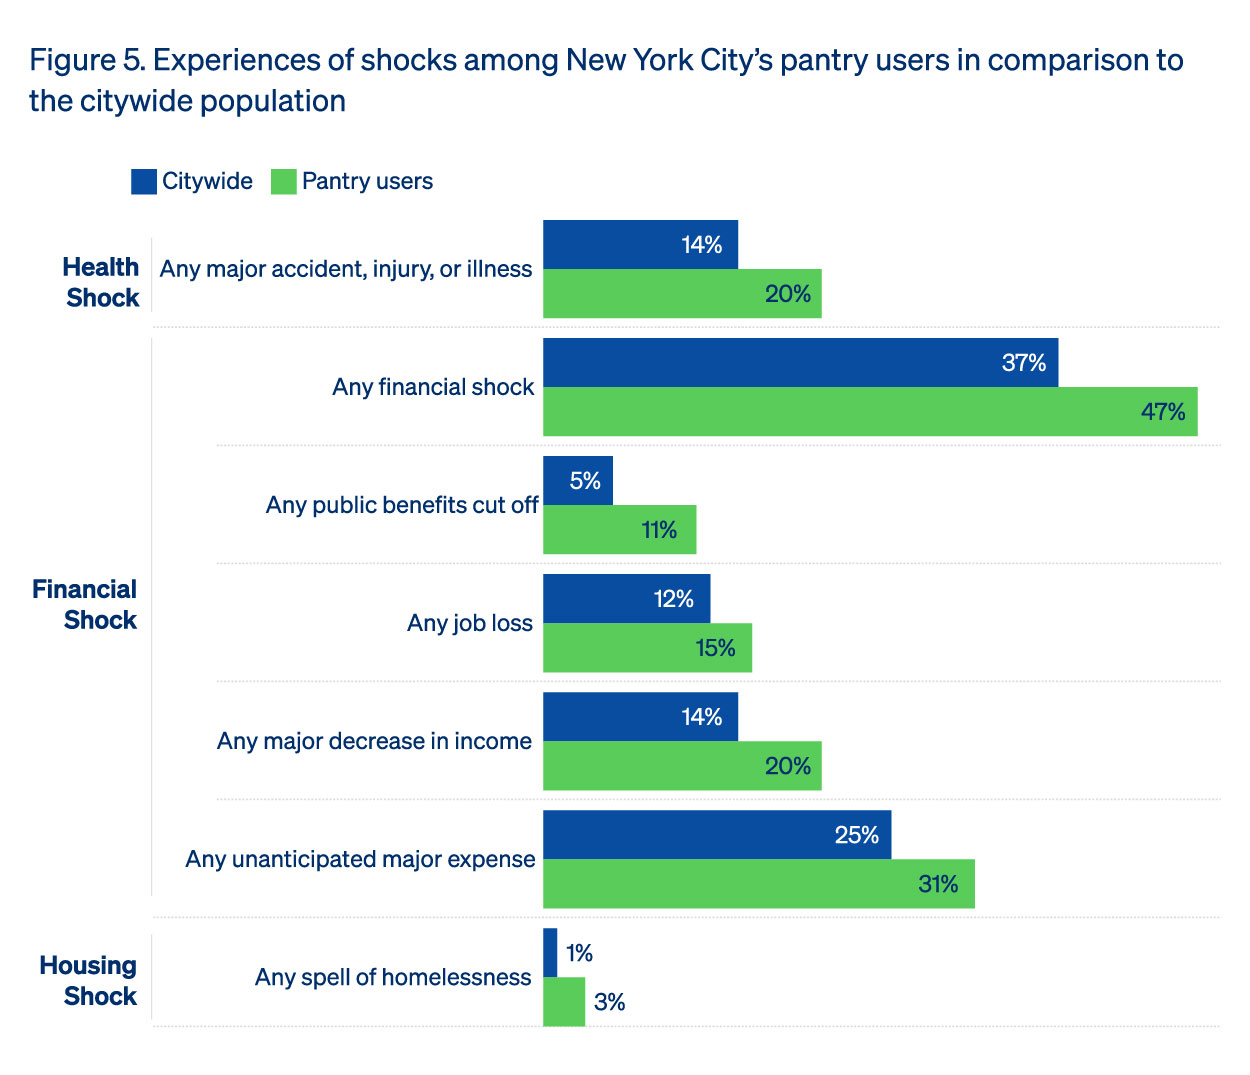
- In an average year, half (47%) of pantry users experience a major shock to their finances and 1 in 5 experience a major health shock.
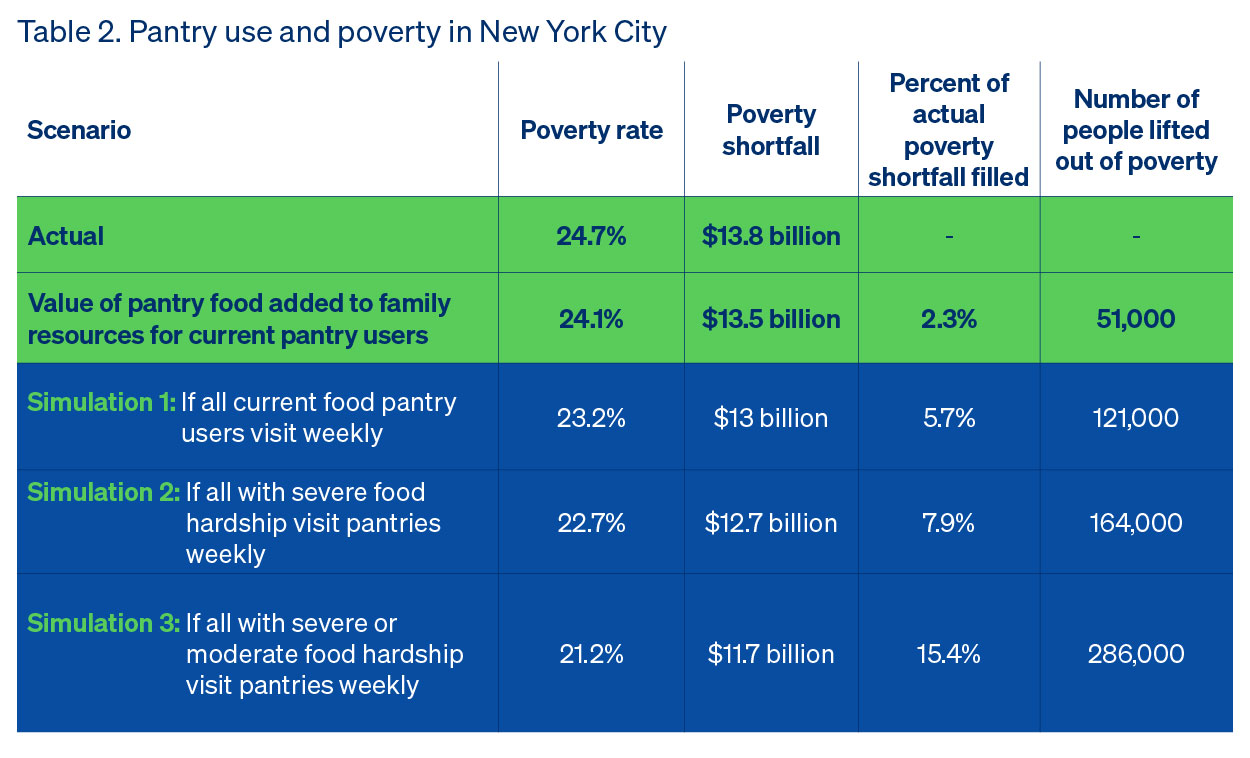
- The food distributed currently by New York City’s food pantry system has a monetary value that lifts more than 50,000 New Yorkers out of poverty.
- If all pantry users and New Yorkers experiencing food hardship tapped the pantry network on a weekly basis, as many as 300,000 New Yorkers could be lifted out of poverty. This would necessitate a major increase to the system’s current capacity and require dedicated resources that are unlikely to sustainably fill the gaps left by cuts to government food assistance.
Food Hardship & Food Pantry Use in 2025
2025 represents an inflection point in how people across the country access the food they need. Federal cuts to the food safety net began to take effect in the latter half of the year, and are continuing on into 2026 and beyond. This could lead to increases in food hardship in the years to come as more New Yorkers lose access to their SNAP benefits (and Medicaid).
In 2025, our most recent year of survey data, 31% of New Yorkers experienced any food hardship, defined as sometimes or often running out of food or worrying that food will run out before having money to buy more (Figure 1). Figure 1 also shows the corresponding rates of severe food hardship: 6% of New Yorkers experienced severe food hardship, defined as often running out of food or worrying that food will run out. This translates to more than 500,000 New Yorkers often running out of food or worrying that food will run out before having money to buy more (Figure 1).
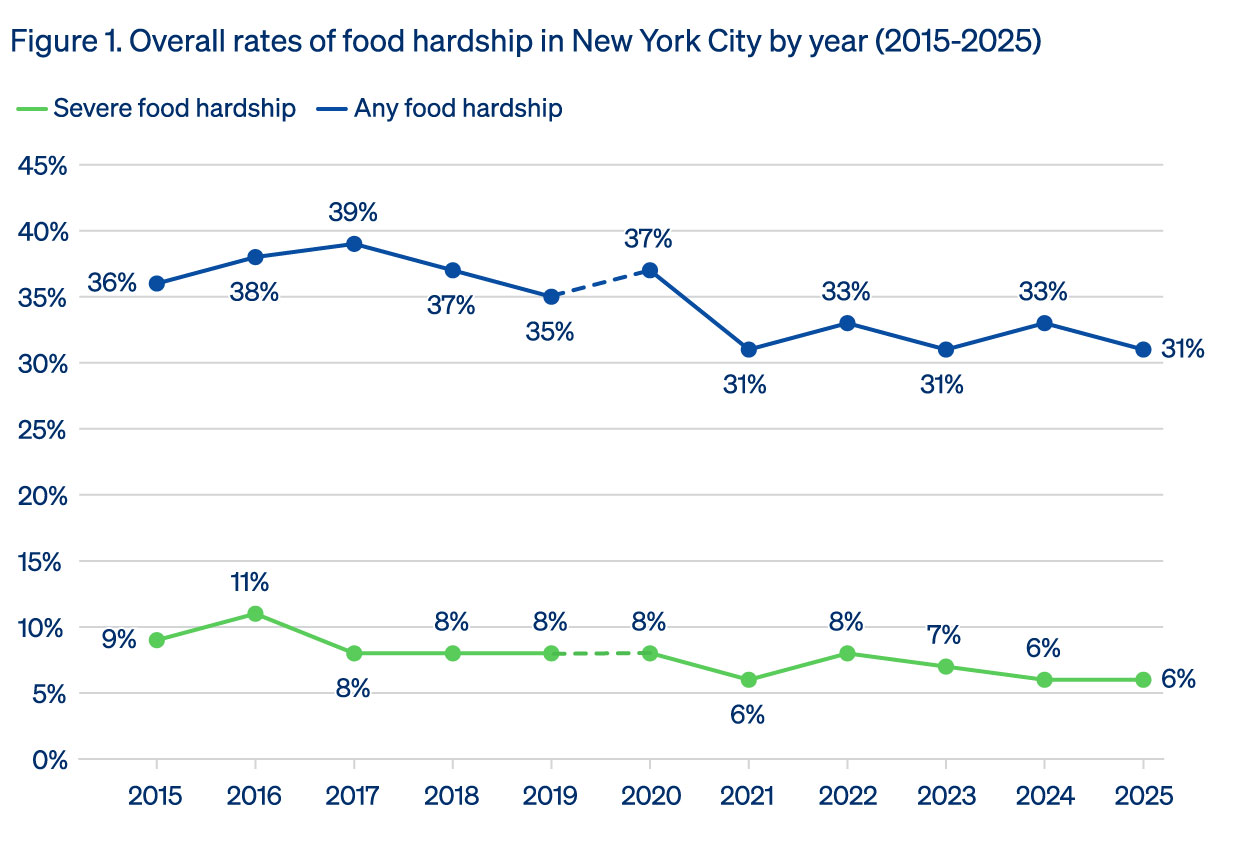
Source: Single year estimates are derived from Poverty Tracker annual survey data, 2015-2025. In 2020, the Poverty Tracker sampling design changed to include an oversample of New Yorkers of Chinese descent, including those who speak Mandarin or are able to complete surveys in simplified or traditional Chinese. Thus, pre-2020 results are not directly comparable to results from 2020 to the present, which we signify with a dotted line break in the New York City trend line.
When it comes to accessing free food assistance from pantries and other food providers, 15% of New Yorkers — or nearly 1.3 million people – reported using a food pantry in 2025 (Figure 2). Trends in pantry use are edging upwards again following a decline as the COVID-19 pandemic subsided, and remain well above pre-pandemic levels.
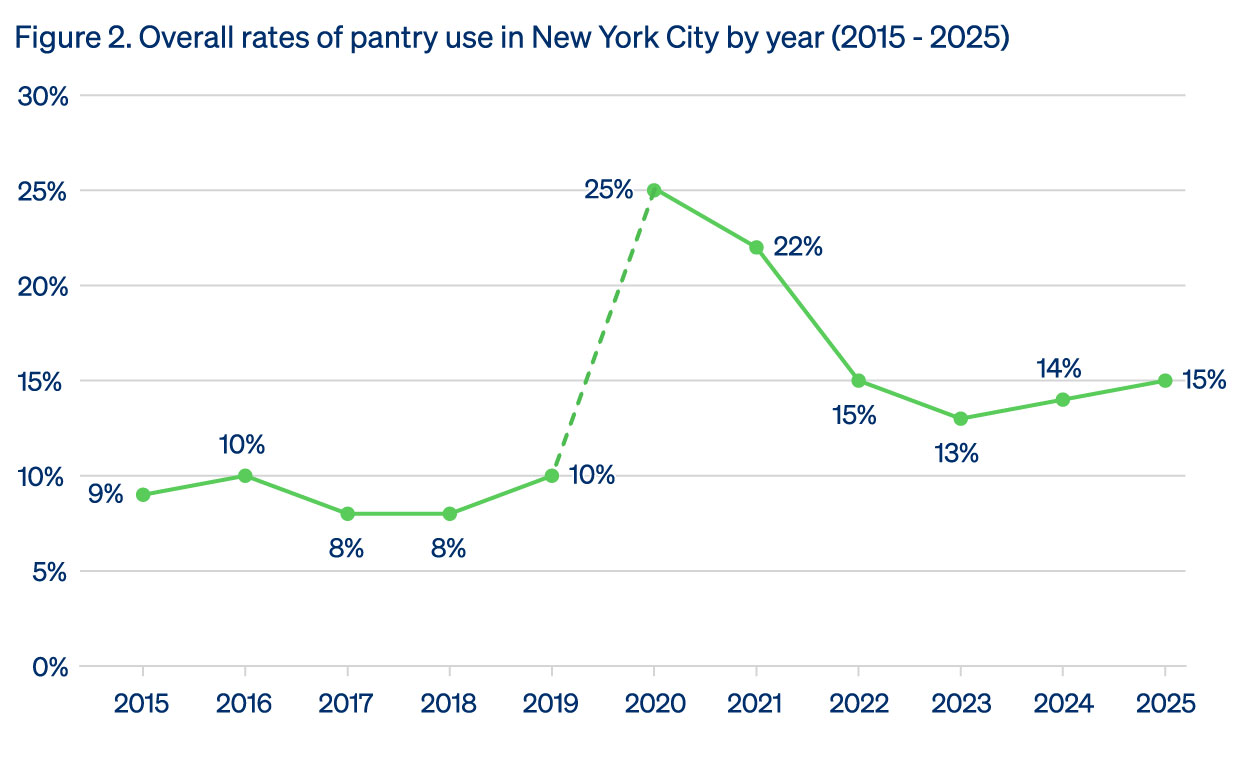
Source: Single year estimates are derived from Poverty Tracker annual survey data, 2015-2025. In 2020, the Poverty Tracker sampling design changed to include an oversample of New Yorkers of Chinese descent, including those who speak Mandarin or are able to complete surveys in simplified or traditional Chinese. Thus, pre-2020 results are not directly comparable to results from 2020 to the present, which we signify with a dotted line break in the New York City trend line.
Who Uses the City’s Pantry System?
Who uses the city’s network of pantries and free food? In this section we document the rates of pantry use in the city as well as the profile of pantry users in comparison to the city at large.
A broad cross-section of New Yorkers uses the city’s pantry system. Table 1 shows the demographic profile of pantry users in the city, compared to the population of all adults citywide. Black and Hispanic New Yorkers, as well as New Yorkers with lower educational attainment, use the pantry system at higher rates than the population at large, reflecting these New Yorker’s lower average incomes and elevated experiences of hardship. Pantry users skew older than the population at large — among those accessing free food providers, 1 in 4 (26%) are age 65 or older and nearly half (44%) have an adult age 65 or older in their family. Similarly, a modestly higher percentage of pantry users have a child in the home compared to the overall city population.
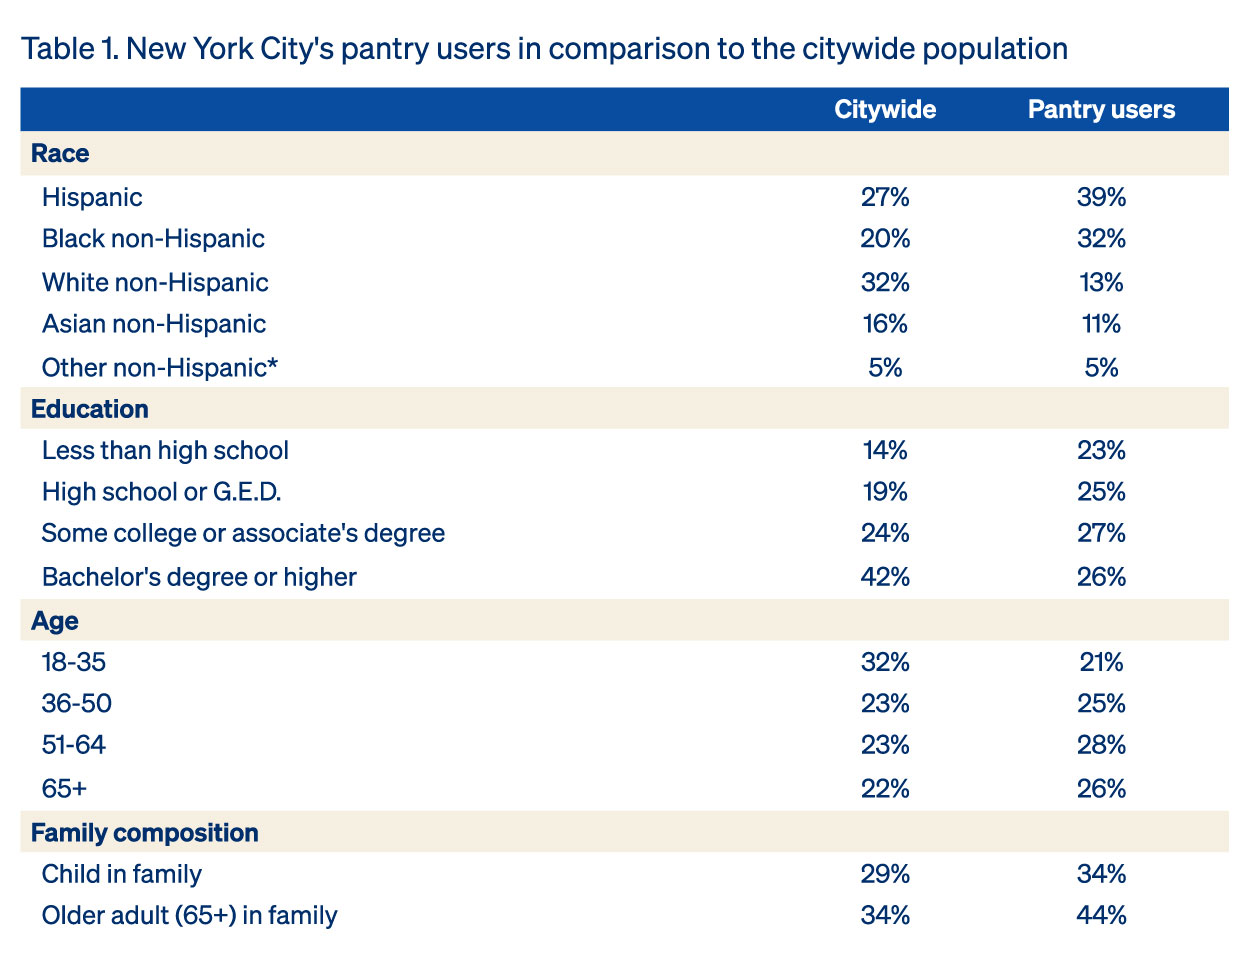
Source: Findings drawn from Poverty Tracker data collected from the second, third, fourth, fifth, and sixth cohorts. Note: Due to rounding, percentages may not sum to 100%. *Interpret with caution due to sample size constraints.
Many New Yorkers seek free food providers as a resource to mitigate any food insecurity they may be experiencing, but often they are also burdened by and coping with other forms of disadvantage. Three-quarters of food pantry users (74%) experienced at least one other form of material hardship besides food hardship — meaning that, in a typical year, the vast majority of pantry users face housing instability, energy insecurity, financial problems, or they refrain from getting the medical attention they need because of the cost (Figure 3). In addition to experiences of hardship, more than 1 in 3 (37%) pantry users have a work-limiting health condition or poor health in general, nearly double the share of adults with these health problems citywide (22%). Pantry users also face elevated rates of serious psychological distress (16%) relative to the citywide population (12%). Thus, despite servicing a cross-section of the city population, pantry users are coping with elevated levels of hardship and health-related stressors than the broader population citywide.
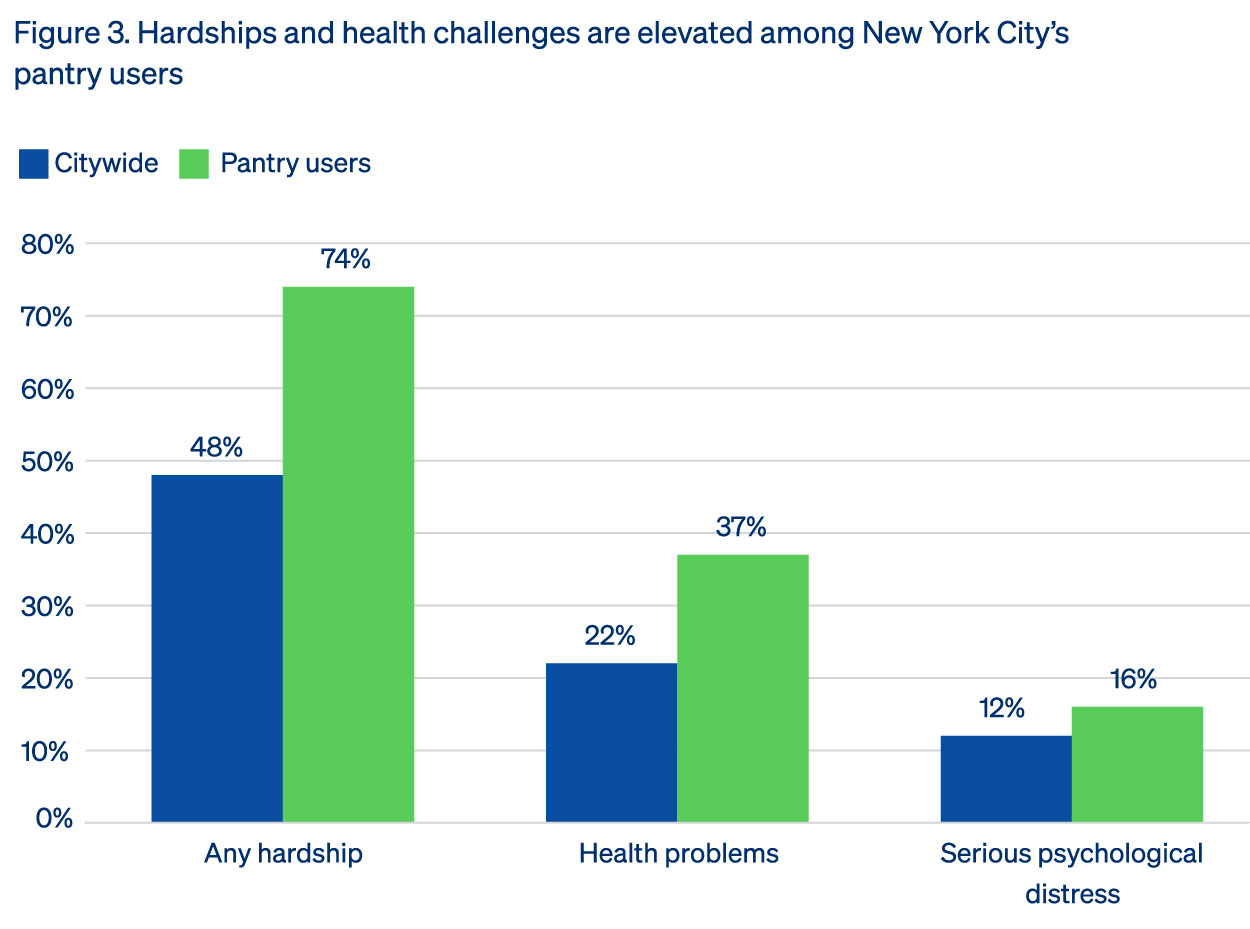
Source: Findings drawn from Poverty Tracker data collected from the second, third, fourth, fifth, and sixth cohorts.
Workforce participation
The affordability crisis is far-reaching and New Yorkers who are fully employed or engaged with the labor market are also relying on food pantries to obtain the food they need. More than half (55%) of adults getting assistance from free food providers are working or living with a spouse or partner who works (Figure 4). Of the 45% who remain, the vast majority are either no longer of working age (18%) or are facing a severe health problem (19%), defined as having a work-limiting health condition or poor health. Only a very small share of pantry users are working-age adults who did not work and did not report health problems — 6%, the same as the share of nonworking healthy New Yorkers citywide.
Source: Findings drawn from Poverty Tracker data collected from the second, third, fourth, fifth, and sixth cohorts. Note: Due to rounding, percentages may not sum to 100%.
Many pantry users have recently experienced a financial shock
Many New Yorkers turn to the pantry system in times of acute distress. The Poverty Tracker is a unique dataset for tracking the proportion of New Yorkers experiencing what we call “shocks,” or events that disrupt families’ finances and wellbeing. These shocks were quite common among pantry users, and more prevalent than among the city population as a whole. In an average year, for example, 20% of food pantry users experience a health shock such as an accident, injury, or illness, and nearly half (47%) experience a financial shock like losing public benefits, losing a job, a major decrease in income, or an unanticipated major expense (Figure 5). Life shocks can have long-lasting effects on New Yorkers’ health and finances, leading many New Yorkers to turn to food pantries when they experience major life disruptions to weather these changes and stay afloat. These shocks are all elevated among the population using pantries relative to the city population as a whole. Contrary to some public perceptions, only a small minority of pantry users have recently experienced a spell of homelessness (3%), though we note that the Poverty Tracker may underrepresent those experiencing a lack of regular housing.
Source: Findings drawn from Poverty Tracker data collected from the second, third, fourth, fifth, and sixth cohorts.
What Role Could the Food Pantry System Play in Reducing Poverty and its Severity?
New Yorkers who use food pantries often turn to free food providers to fill food gaps that they are unable to meet otherwise in budgets already stretched thin. We examine how much food pantries are helping families financially by valuing the food they receive from free food providers and adding the value of the meals they received to their family financial resources. We treat this value like other food-related assistance such as SNAP, as free food assistance provides direct resources to families that we can quantify. Considering the value of the food families receive as a supplementary financial resource, we recalculate poverty to analyze the anti-poverty effects of current food pantry use in New York City.
How are the meals that families in New York City receive from the food pantry system valued?
To calculate the monetary value of food accessed through the pantry system, we use data from Feeding America, which provides borough-level price estimates of the cost of an average food pantry meal, and which establishes that a standard food pantry meal distribution typically includes 9 meals per person in the family.
We calculate the total number of meals a family receives by first multiplying the number of people in the family by the number of meals allotted to each family member in a standard food pantry distribution. This provides the number of meals a household is expected to receive during a food pantry visit. We then take the family’s frequency of food pantry use, convert it to weeks, and multiply the number of meals by the number of weeks to obtain the total number of meals the family receives (or would be projected to receive) across the 12-month reference period.
Finally, we calculate the average cost of a food pantry meal across the five boroughs and multiply the total number of meals received by this amount to obtain the total monetary value of the food pantry meals. With this monetary value in hand, we add the value of pantry use to each family’s total financial resources and then recalculate poverty and the poverty shortfall.
What is the Povery Shortfall?
The poverty shortfall, sometimes referred to as the poverty gap, is the total amount of resources required to lift everyone living in poverty out of poverty. This amount is estimated by calculating the gap between the family resources of a family living in poverty and the poverty threshold for that family. The amount by which a family’s resources fall below the poverty threshold can be summed across all families living in poverty in New York City to estimate the total amount of resources it would require to lift this population up to the poverty line.
We then explore the potential anti-poverty effects of food pantries if they were more widely used in New York City under three different simulated scenarios:
- Simulation 1: The first simulation models weekly use by all current food pantry users.
- Simulation 2: The second simulation builds on this and models weekly use by current food pantry users and by New Yorkers experiencing severe food hardship.
- Simulation 3: The third simulation further expands food pantry use and models weekly pantry use by current pantry users and by New Yorkers experiencing any type of food hardship, or those who sometimes or often run out of food or worry about running out of food before having enough money to buy more.
We note that this exercise is a thought experiment to better understand the potential of and limits to the free food assistance system in the city in the wake of major cuts to the SNAP program and other policies that New Yorkers benefit from to make ends meet. More frequent pantry use would depend on the system, which is already financially strained, having the backing required to fill this need, and even with additional resources it is always best seen as a complement rather than a substitute for public food assistance.
In an average year from 2022 to 2024, a quarter of New Yorkers were living in poverty (24.7%). If we put a monetary value on the free food assistance that New Yorkers currently report receiving, we see a small reduction in the poverty rate to 24.1%, indicating that the pantry system at current capacity lifts about 51,000 New Yorkers out of poverty and reduces the poverty rate by about 2% (Table 2). The poverty shortfall is also reduced by about 2%, defined as the percent of the total dollars necessary to lift all New Yorkers out of poverty in a given year.
Source: Findings drawn from Poverty Tracker data collected from the second, third, fourth, fifth, and sixth cohorts.
We proceed to simulate how increased pantry usage would change the poverty rate and poverty shortfall in the city. In the first simulated scenario, we modify usage so that all current food pantry users receive food weekly. This results in an increase in the anti-poverty potential of food pantries, reducing poverty by 6% (to 23.2%). The poverty shortfall would also be reduced by nearly 6%.
In the last two scenarios we simulate expanded food pantry use by those who experience food hardship but aren’t currently utilizing free food assistance. We run these simulations to illustrate how much antipoverty impact could be generated from free food assistance. It is important to note that these simulated increases in utilization would require the system to be adequately resourced to accommodate increased demand. Rather than representing an ideal scenario for pantry use, we argue that the results provide a ceiling for what can be expected from the city’s free food system given the impending (and occurring) cuts to government food assistance.
If all current pantry users tapped the pantry system weekly, alongside current non-users who experience food hardship, we estimate that the poverty rate could fall to as low as 21.2%, filling about 15% of the overall poverty shortfall in the city. Such increased participation and utilization levels would require new resources injected into an already strapped food delivery system. So while there is power to reduce the poverty shortfall in the city more through increased food provision, and this remains a worthy goal, the pantry system should not be thought of as a substitute for the support provided through major government programs like SNAP. Nevertheless, the system does reduce the city’s poverty shortfall and remains an important complement to government food assistance.
Policy Implications & Conclusion
The federal government has passed major cuts to the SNAP program, which are already resulting in reduced access to government food assistance. Food hardship remains a major problem in New York City and increasing numbers of New Yorkers are once again turning to the free food assistance system in the city to cope. This spotlight has documented the portrait of the wide cross-section of New Yorkers who utilize the pantry system at some point throughout the year. The population utilizing pantries looks largely like the city as a whole, though is more likely to be older, to have children, and to come from groups with higher poverty rates. The population utilizing pantries is also dealing with elevated levels of material hardships and health challenges. Despite high levels of engagement in the labor market, many pantry users are struggling with health challenges and are coping with recent shocks to finances and well-being.
These numbers mean that the free food assistance system in the city is providing a needed complement to government food assistance. Currently levels of assistance moderately reduce the city’s poverty shortfall, and lift a significant number of New Yorkers out of poverty. With increased utilization, the poverty shortfall could be further reduced, though the data reveal that there are limits to this poverty reduction even under liberal assumptions about potential pantry use among non-users. Given this, we need to both adequately resource the city’s pantry system to be able to absorb forecasted increases in demand, while also making sure that the system remains a complement — not a substitute — for policy. Policy actions to reduce food hardship in New York City should seek to reinforce the resources free food providers can count on and facilitate New Yorkers’ ability to access the government resources and food assistance programs they are entitled to tap into. These types of policies include investing in:
- Tax credits and accounts: Make sure all eligible families get federal and state refundable tax credits and can use tax-advantaged accounts. These include the Earned Income Tax Credit, Trump Accounts, and the Empire State Child Credit.
- SNAP Navigators: Fund more Navigators to help New York families apply for and keep SNAP benefits.
- Emergency food: Boost funding for food pantries and other emergency food providers so they can distribute nutritious food. Key programs include the Hunger Prevention and Nutrition Assistance Program (HPNAP), Nourish NY, and Community Food Connection.
- WIC: Give more funding to the Women, Infants, and Children (WIC) nutrition program to update and stabilize its operations and reach more eligible New Yorkers.
- EBT security: Ensure a smooth switch to Electronic Benefits Transfer (EBT) cards with chip and tap-to-pay and create a fund to repay families who lost SNAP benefits to theft.
- SNAP benefit levels: Raise minimum SNAP benefits and find other ways to give families the money they need for food, regardless of citizenship status.
Food pantries help fight poverty, but they cannot replace strong policy. Our data shows that rising pantry use is a sign of deeper hardship. New Yorkers need stronger, more effective support to meet these challenges.