March 2026
Annual Report: The State of Poverty and Disadvantage in New York City Vol. 8
This year’s report reveals that more New Yorkers were in poverty than at any other point since the Poverty Tracker began collecting data more than 10 years ago: 2.2 million people overall (one in four), including 1.7 million adults (25%) and 450,000 children (more than one in four).
Contributors: Lily Bushman-Copp, Chloé Cargill, Eunho Cha, Sophie Collyer, Lolita Colon, Qin Gao, Irwin Garfinkel, Janira Gayle, Sofia Giorgianni, Sienna Granillo, Sonia Huq, Yajun Jia, Stephen Karlya, Anastasia Koutavas, Michael Langburd, Isabel Laus, Helen Leon, Xiaofang Liu, Sally Ma, Francesca Michielli, Angie Moran, Kathryn Neckerman, Conner Radke, Benjamin Elijah Ramos-Guzman, Angel Rivera, Gerardo de la Rosa, Schuyler Ross, Christina Ruder, Daniel Salgado, Katerina Salony, Traci Schwinn, Brian Rafael Torres, Julien Teitler, Ryan Vinh, Jane Waldfogel, Kahlen Washington, Christopher Wimer, Jiajun (Mike) Wu, Christopher Yera, Hanqiao Zhang
Issues Areas: Annual Report, Financial Security, Food Hardship, Housing Hardship
INTRODUCTION AND KEY FINDINGS
In 2023, 2.1 million New Yorkers lived in poverty, 100,000 more people than in 2022. This rise in poverty between 2022 and 2023 was driven largely by rapid inflation, which also explained the national increase in poverty between these years. As inflation slowed in 2024 and the economic consequences of the pandemic continued to recede, one might have expected the city’s poverty rates to fall between 2023 and 2024, possibly returning to pre-pandemic levels. Unfortunately, as shown in this report — the eighth volume of The State of Poverty and Disadvantage in New York city — no such decline occurred. More New Yorkers were in poverty in 2024 than at any other point since the Poverty Tracker began collecting data more than 10 years ago.
Using the latest Poverty Tracker data, this report documents how New Yorkers fared in 2024 and how their experiences of economic disadvantage compare to years prior. We document trends in income poverty, material hardship (i.e., chronic or acute difficulty making ends meet), and health problems; examine how these experiences vary across demographic groups; and analyze the extent to which poverty, hardship, and health problems overlap. The latest data show that in 2024, nearly 2.2 million New Yorkers — more than 1 in 4 — lived in poverty, and that the city’s poverty rate was twice the national average.
The increase in New York City’s poverty rate in 2024 and a national poverty rate that exceeds prepandemic levels underscores the need for bold and meaningful policy intervention, as we saw at the height of the pandemic. Such a response, however, is unlikely to come from the federal government. In the summer of 2025, the H.R.1 Budget Reconciliation Act (sometimes referred to as the One Big Beautiful Bill Act, or OBBBA) implemented far-reaching changes to federal policy, affecting the tax code, federal health insurance programs, anti-hunger programs, and other core safety net policies. These changes are expected to substantially shrink two of the nation’s longest-standing and largest safety net programs — the Supplemental Nutrition Assistance Program (SNAP) and Medicaid — which support individuals and families struggling to afford food and medical care, even when working full time. Cuts to SNAP and Medicaid, as well as future cuts to federal safety net programs that have been discussed and may take effect, are likely to worsen the experiences of poverty and economic hardship documented in this report. In the Spotlight section of this report, we focus on those most likely to be affected by these federal policy cuts, particularly reductions to SNAP, and we document how they are currently managing life in New York City and what is at stake for them given these federal policy changes.
The contraction of the federal safety net will carry wide-ranging consequences, but state and local policymakers also have the opportunity to fill the gaps left by federal cuts and to implement policies they know can support individuals across New York City and State. At the state level, this includes increasing funding for emergency food providers statewide and supplementing SNAP benefits with state funds, as well as continuing to expand the Empire State Child Tax Credit and the Housing Access Voucher Program, which helps households avoid homelessness. To combat cuts to Medicaid, New York State should consider funding health insurance coverage for the nearly half a million New Yorkers who are at risk of losing coverage under the Essential Plan as a result of OBBBA and invest in Community Health Centers, which provide crucial medical services to New Yorkers statewide. At the local level, Mayor Mamdani’s ambitious plans to address the affordability challenges that have long plagued New York city can also help mitigate the harms caused by federal cuts. His proposals to expand no cost childcare, increase the city’s minimum wage, and increase the supply of affordable housing are just some of the measures that could alleviate these burdens. While the challenges facing the city and state are substantial, focusing efforts on policies known to alleviate poverty and economic hardship is imperative for reversing the trends documented in this report.
GUIDE TO THIS REPORT
- In section 1, we focus on three types of disadvantage: income poverty, material hardship, and health problems (including psychological distress), and we present trends since 2015 for each type of disadvantage.
- In section 2, we analyze how these experiences vary for New Yorkers of different demographic groups.
- In section 3, we examine overlapping experiences of disadvantage among New Yorkers, again looking at poverty, material hardship, and health problems.
- In section 4, we spotlight New Yorkers who receive SNAP benefits and discuss how recent federal policy changes could exacerbate the economic challenges that they are already facing.

Key Findings and Conclusions:
Poverty and Disadvantage in New York City
- More New Yorkers lived in poverty in 2024 (nearly 2.2 million) than at any other point since we began collecting Poverty Tracker data more than 10 years ago. This included more than 1.7 million adult New Yorkers (25%) and nearly 450,000 children (27%).
- New Yorkers living below the poverty line were not the only ones struggling to get by — in 2024 nearly 5 million New Yorkers (59%) had incomes below 200% of the poverty line in 2024 and a third (33%) had low incomes (i.e., incomes between 100-200% of the poverty line).
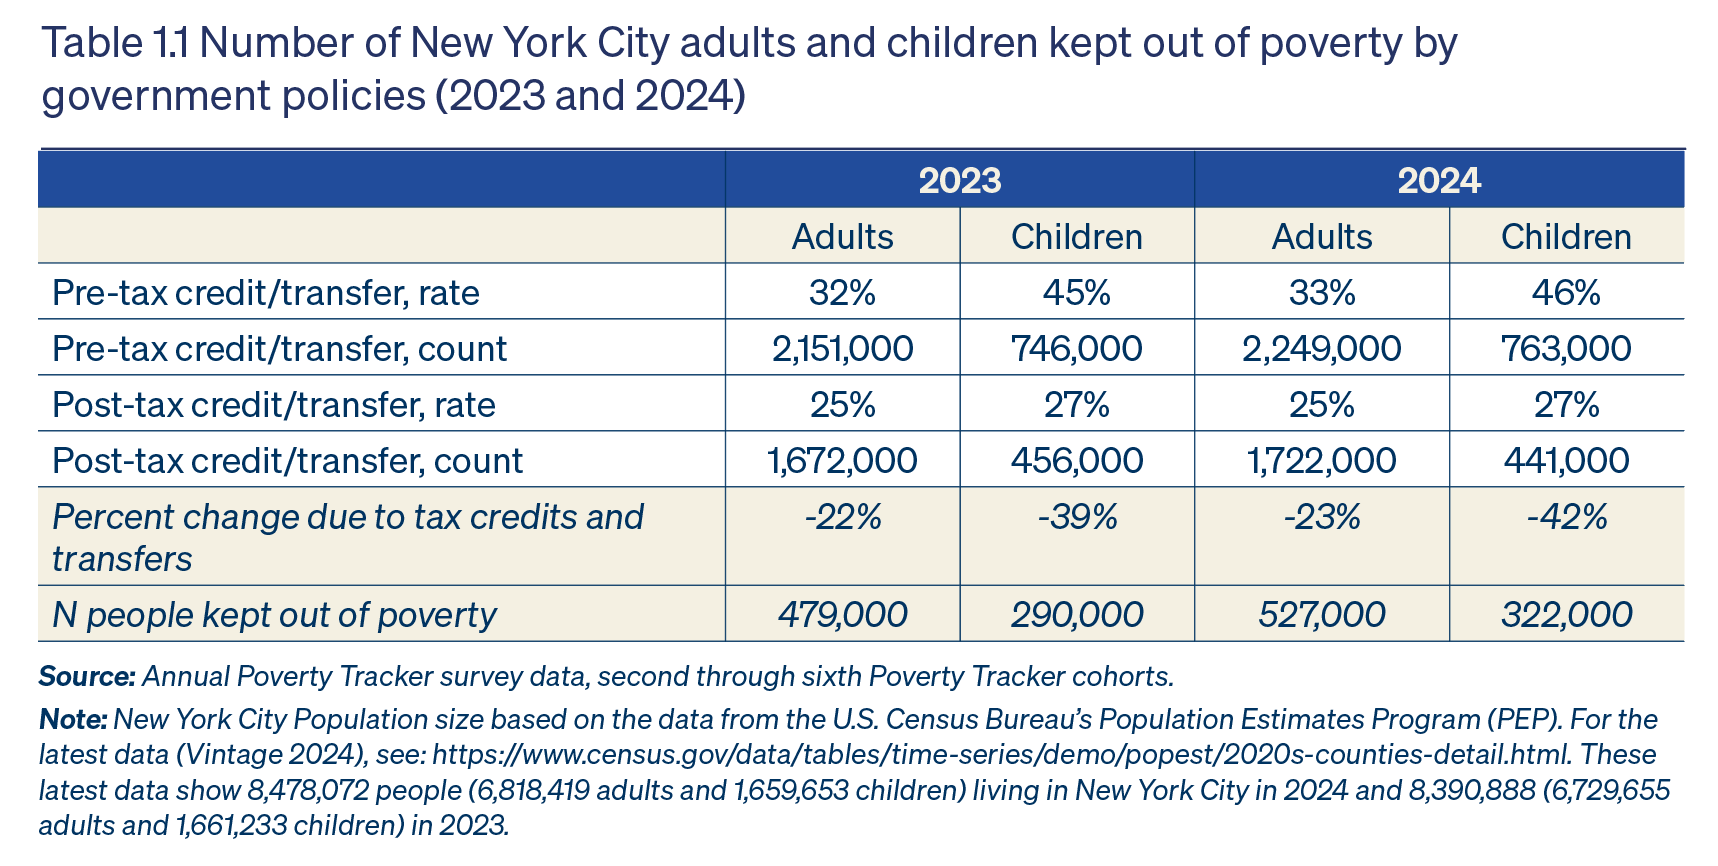
- Still, in 2024, government transfers and tax credits cut the adult poverty rate in New York City by 23% and the child poverty rate by 42%, keeping more than half a million adults and more than 300,000 children above the poverty line. These effects are similar to those in 2023, when government transfers and tax credits cut the adult poverty rate by 22% and the child poverty rate by 39%.
- Recent cuts to federal safety net programs are likely to shrink the poverty-reducing impacts of government policies in years to come. The state’s recent actions combating child poverty, including the expansion of the Empire State Child Credit, will serve as key, albeit limited, countermeasure to these cuts. State and local policymakers also have opportunities to further fill the gaps left by federal retrenchment.
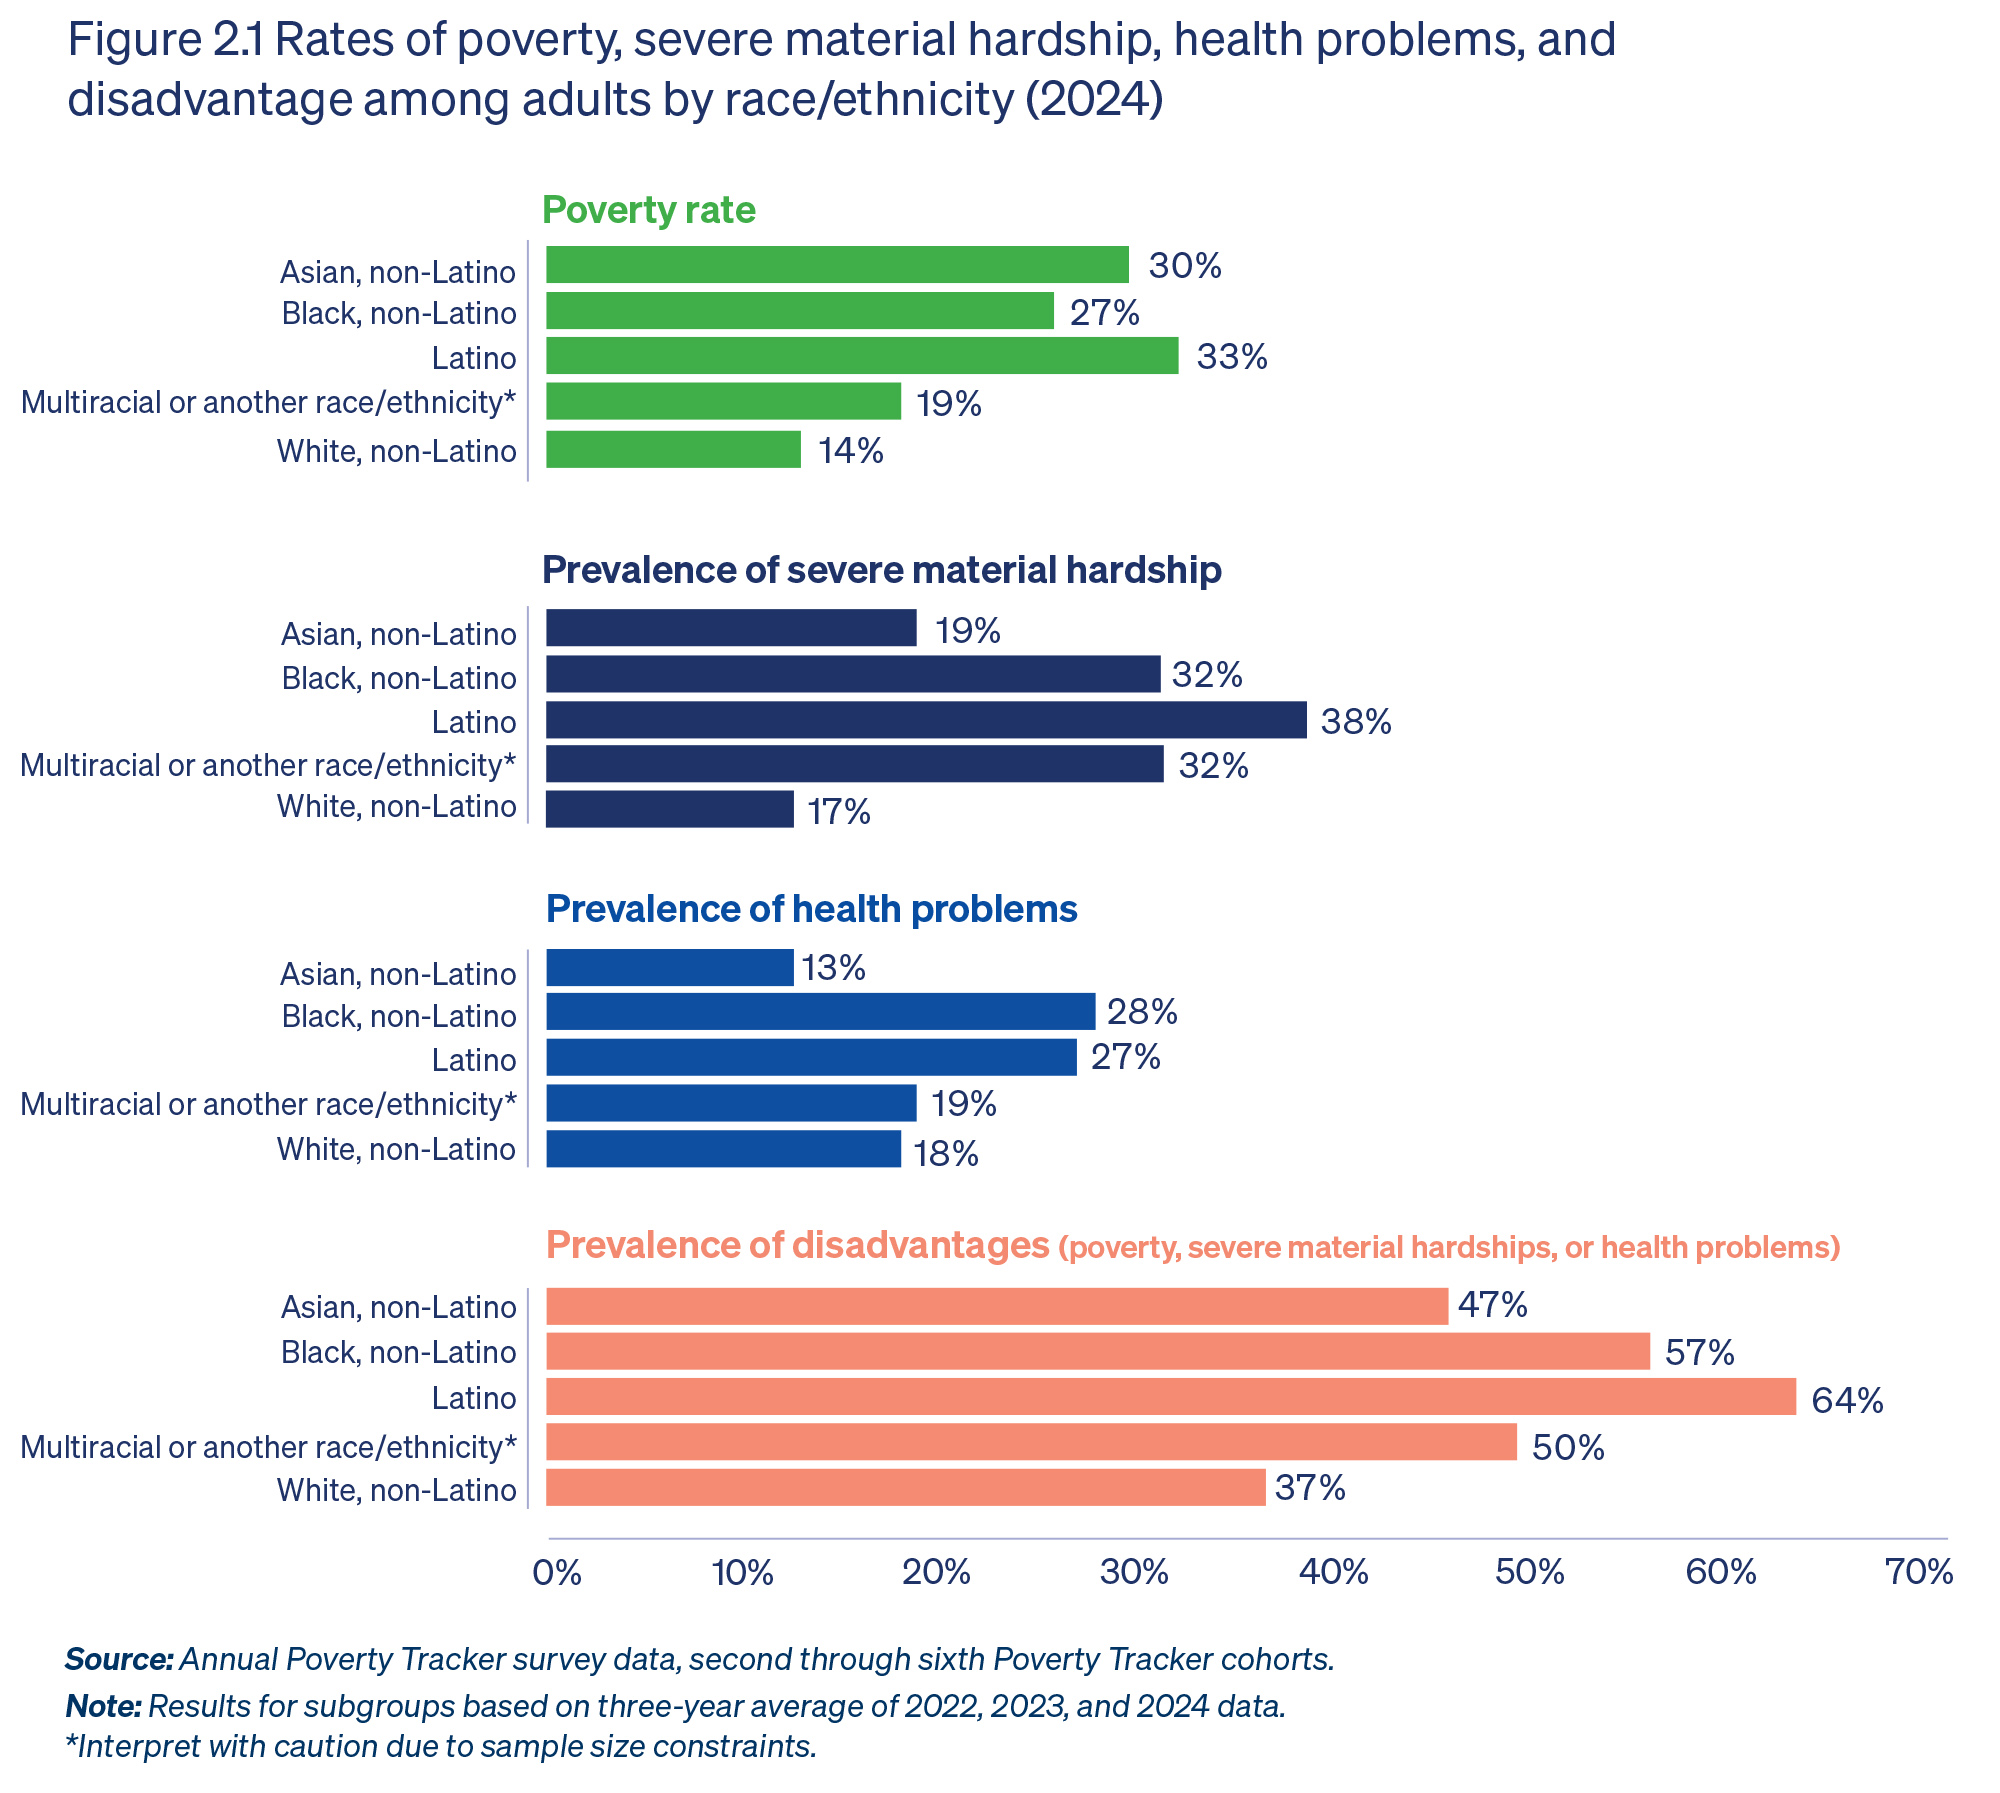
- Asian and Latino New Yorkers were more than twice as likely to live in poverty in 2024 than white New Yorkers (30% and 33% vs. 14%), and rates were similarly elevated among Black New Yorkers (27%). There is suggestive evidence that these gaps may be widening.
- More than half of adults (51%) and children (59%) were in families that experienced at least one form of material hardship in 2024. Roughly 26% of adults and 27% of children were in a family that experienced at least one form of severe material hardship in 2024.
- In 2024, a fifth (20%) of adult New Yorkers experienced a health problem, defined as reporting poor health or having a work-limiting health condition, and more than 1 in 4 (27%) experienced a health problem or serious psychological distress. The prevalence of serious psychological distress remained higher than it was before the pandemic.
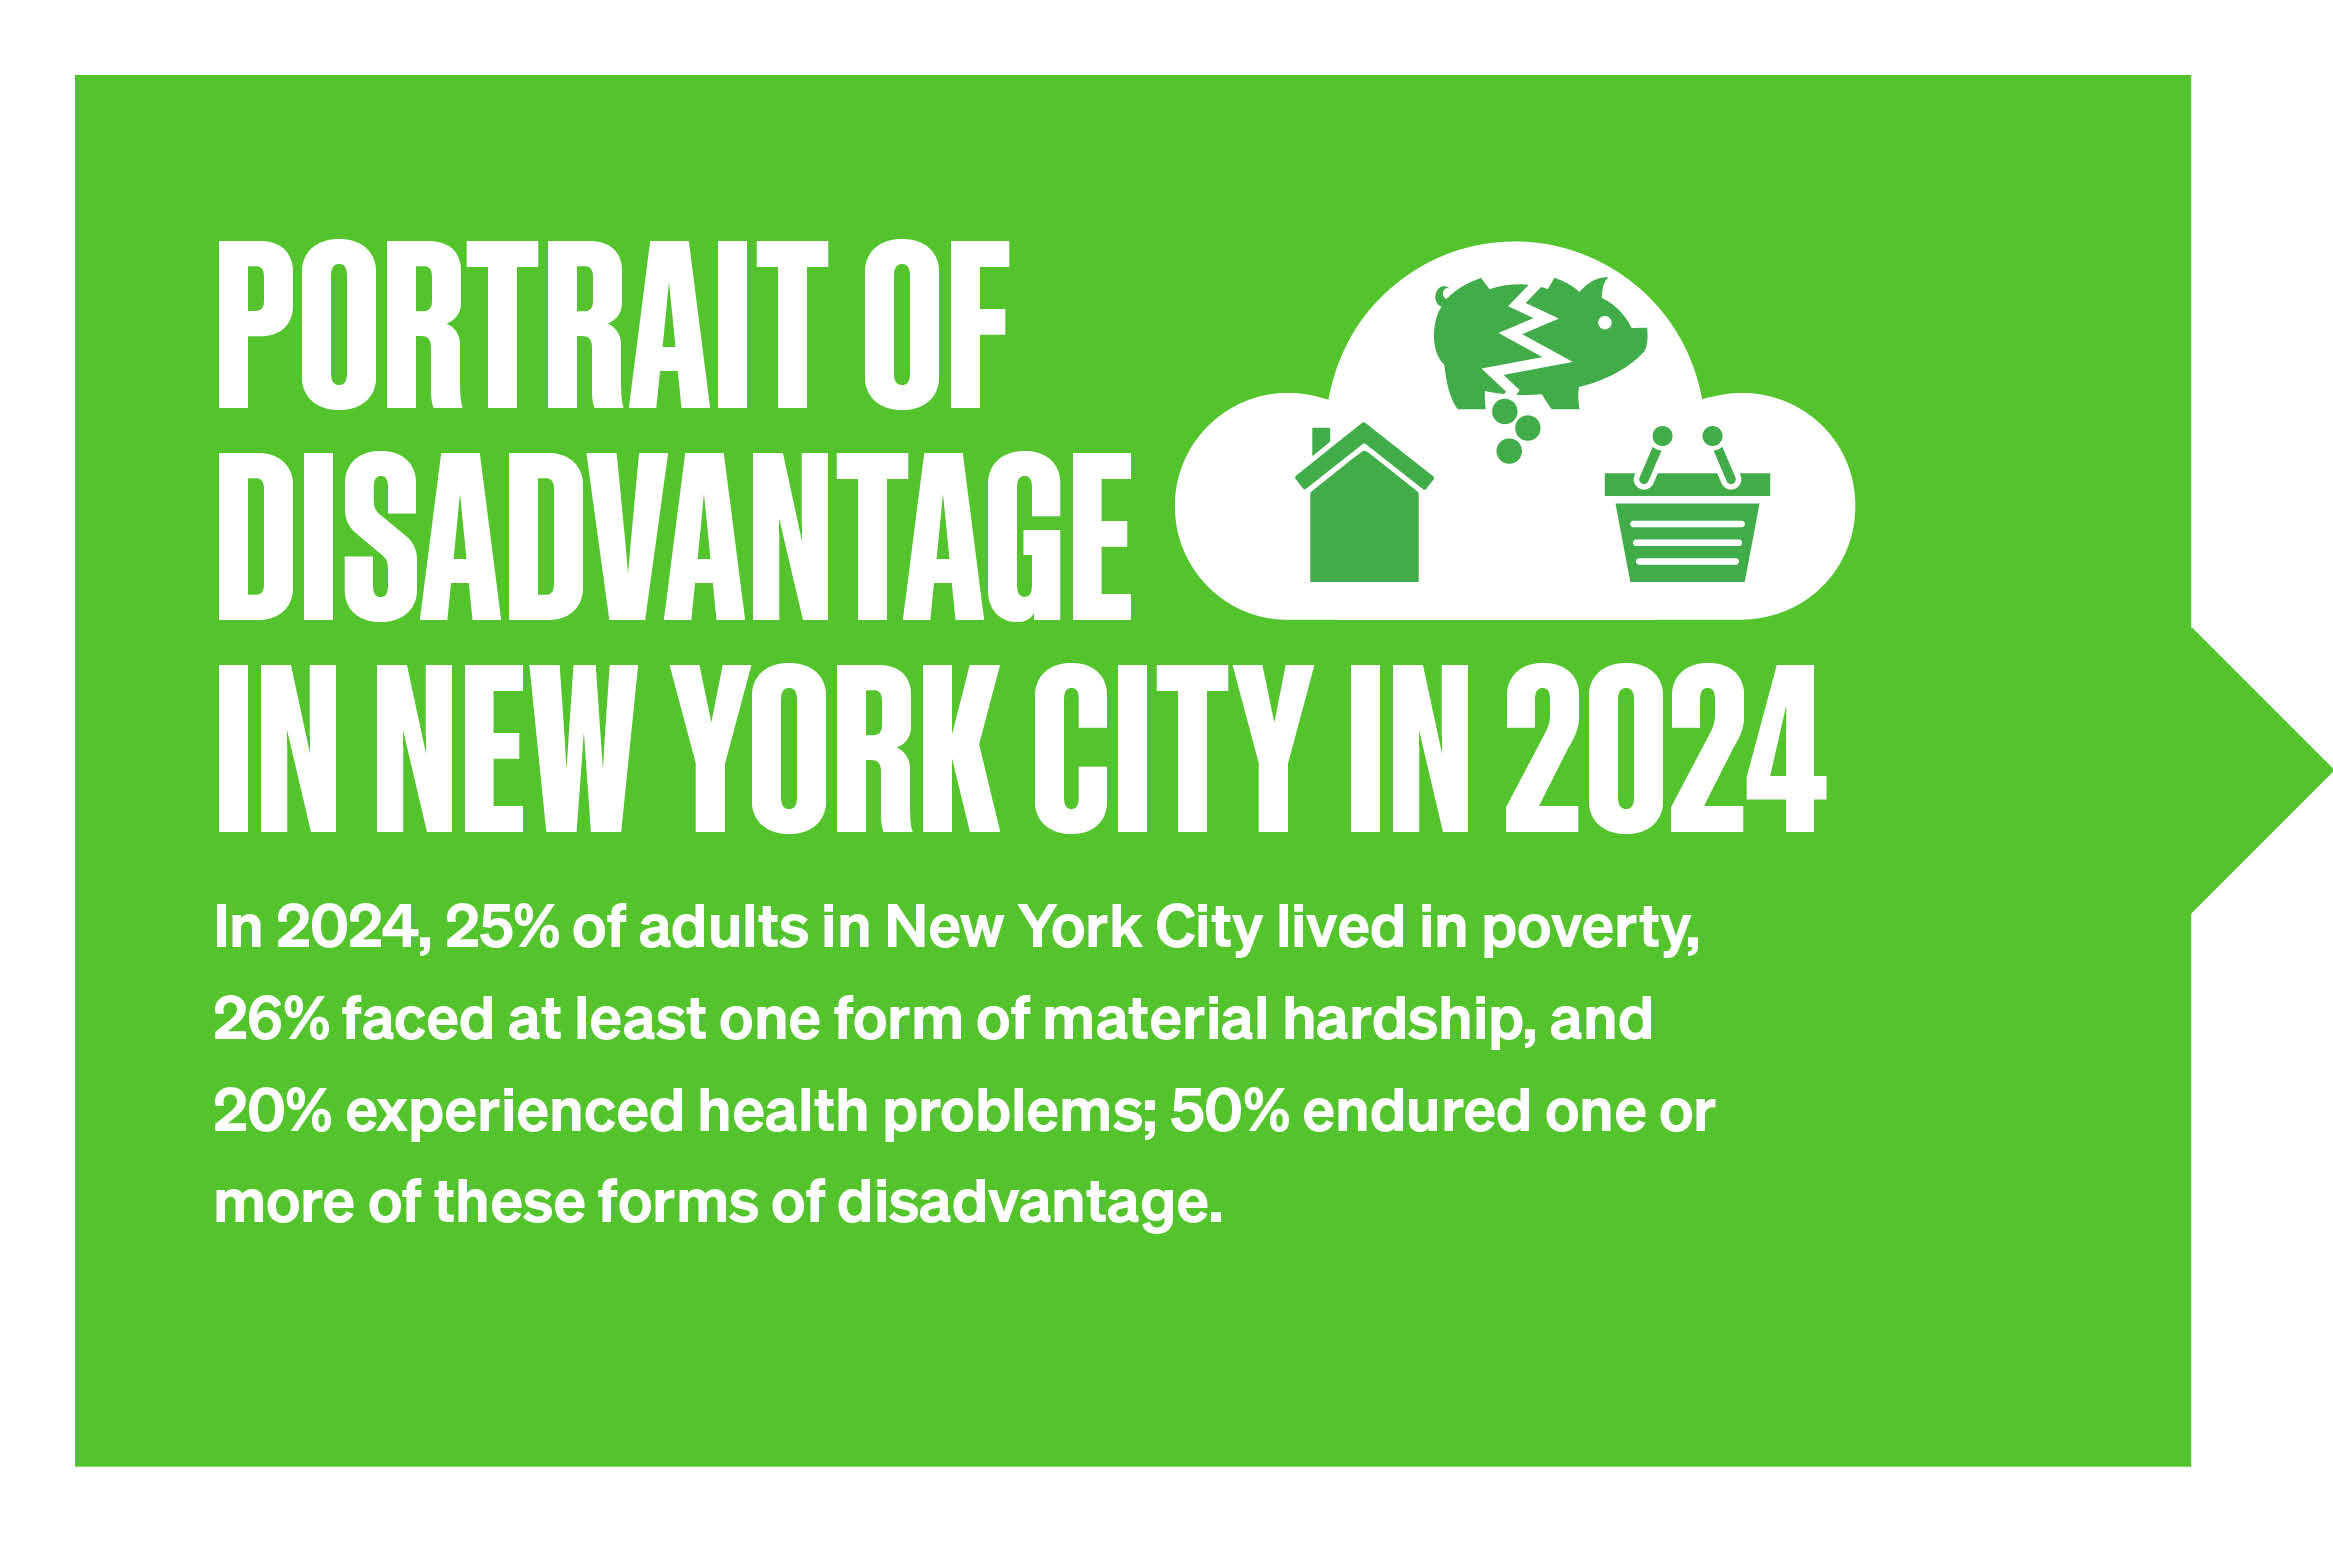
- Half (50%) of adult New Yorkers faced at least one form of disadvantage (poverty, severe material hardship, or health problems) in 2024.
Spotlight on New Yorkers impacted by impending SNAP cuts under OBBBA
- SNAP benefits, as designed under pre-OBBBA policy, lift approximately 1 in 10 recipients in New York City above the poverty line.
- Children and seniors comprise roughly half of SNAP recipients in New York City and also see the greatest poverty reduction effects from the program.
- Despite meaningfully boosting recipients’ incomes, most SNAP recipients continue to face economic challenges as benefits must be stretched to cover food needs while other basic needs may remain unmet. After accounting for benefits, most recipients remain in poverty or are hovering near the poverty line.
- Food hardship remains common among SNAP recipients, even with benefits. More than 60% of SNAP recipients often or sometimes run out of food before they have money to buy more. Roughly 80% of SNAP recipients experience at least some form of material hardship.
- The majority of working-age SNAP recipients in New York City are employed or have a partner who is employed in the years that they receive benefits. However, low wages and unstable employment mean that work often does not translate into economic security. Among those who are not working, most face work-limiting disabilities or health challenges.
- The prevalence of health challenges is particularly elevated among SNAP recipients. Adult SNAP recipients are more than three times as likely to have a work-limiting disability or health condition than non-recipients (52% vs. 16%) and more than twice as likely to rate their health as fair or poor (43% vs. 18%).
- SNAP recipients are often enduring material hardships and health problems. SNAP has historically provided recipients with a stable form of support that helps mitigate these difficulties. Recent federal actions, including cuts to the program and new work-reporting requirements, are likely to exacerbate these challenges.
- While the exact shape of the cuts to SNAP resulting from recent federal action is unknown, estimates suggest the OBBBA SNAP cuts are likely to push roughly 70,000 New York City residents into poverty each year between 2028 and 2034.
Section 1: Citywide Trends in Income Poverty, Maternal Hardship, and Health Problems in New York City
Highlights:
Income Poverty
- Between 2023 and 2024, the New York City poverty rate rose from 25% to 26%.
- More New Yorkers lived in poverty in 2024 (nearly 2.2 million) than at any other point since the Poverty Tracker began collecting data more than 10 years ago. This included more than 1.7 million adult New Yorkers (25%) and nearly 450,000 children (27%).
- In 2024, government transfers and tax credits cut the adult poverty rate in New York City by 23% and the child poverty rate by 42%, keeping more than half a million adults and more than 300,000 children above the poverty line.
Material Hardship
- In 2024, more than half of adults and children lived in families experiencing at least one form of material hardship (51% and 59%, respectively), with rates for both groups higher than in 2023 (50% and 56%).
- More than a quarter of adults and children (26% and 27%, respectively) were in families that experienced severe material hardship in 2024. This reflects an increase in severe hardship among adults relative to 2023 (25%) and decline for children (29%). The decline among children is driven by a reduction in severe hardship among children in families above the poverty line.
- The most common forms of material hardship experienced among New Yorkers in 2024 were food and financial hardship.
Health Problems and Psychological Distress
- In 2024, 20% of New Yorkers experienced a health problem, defined as reporting poor health or having a work-limiting health condition, which marks a modest decline from 2020 (21%). More than 1 in 4 (27%) faced either a health problem or serious psychological distress, also reflecting a modest decline from 2023 (28%). The prevalence of serious psychological distress remains greater than it was prior to the pandemic.
Launched in 2012, the Poverty Tracker surveys a representative sample of New Yorkers several times throughout the year, providing critical information on the dynamics of poverty and other forms of disadvantage in the city. Unlike other surveys, the Poverty Tracker explores how New Yorkers experience poverty and material hardship over time, rather than in a single day, month, or year.
In addition, the Poverty Tracker focuses on more than just income poverty. Annually, the study collects all data necessary to measure three forms of economic disadvantage: income poverty, material hardship, and health problems. We use these measures to understand how certain disadvantages, or multiple, overlapping disadvantages, make it harder for New Yorkers to get by. Here, we examine trends in these key indicators of economic disadvantage between 2015 and 2024 for adults in New York City and for children (where possible). We start by discussing income poverty, then turn to material hardship, and close with health problems. In each section, we provide additional information on how we define and measure these indicators.
Income Poverty in New York City: Measuring Poverty in NYC Using the Supplemental Poverty Measure (SPM)
Every September, the U.S. Census Bureau releases the latest estimates of the national poverty rate using the Official Poverty Measure (OPM). The OPM was developed in the 1960s and compared families’ total before-tax cash income with a poverty line, or threshold. The threshold was defined as three times the cost of a minimally adequate food budget during that time. With the exception of some minor adjustments, this measure has only been updated annually to account for changes in inflation.
Over time, this formula has become increasingly outdated. Food costs have become less important in family budgets, while things like housing and childcare have become costlier. A focus on before-tax cash income ignores benefits that many families receive through the tax system, such as the Earned Income Tax Credit, or in noncash form, such as food stamps or housing vouchers. Importantly, the poverty threshold under the OPM does not vary with regional costs of living, particularly housing costs, which are notoriously high in New York City.
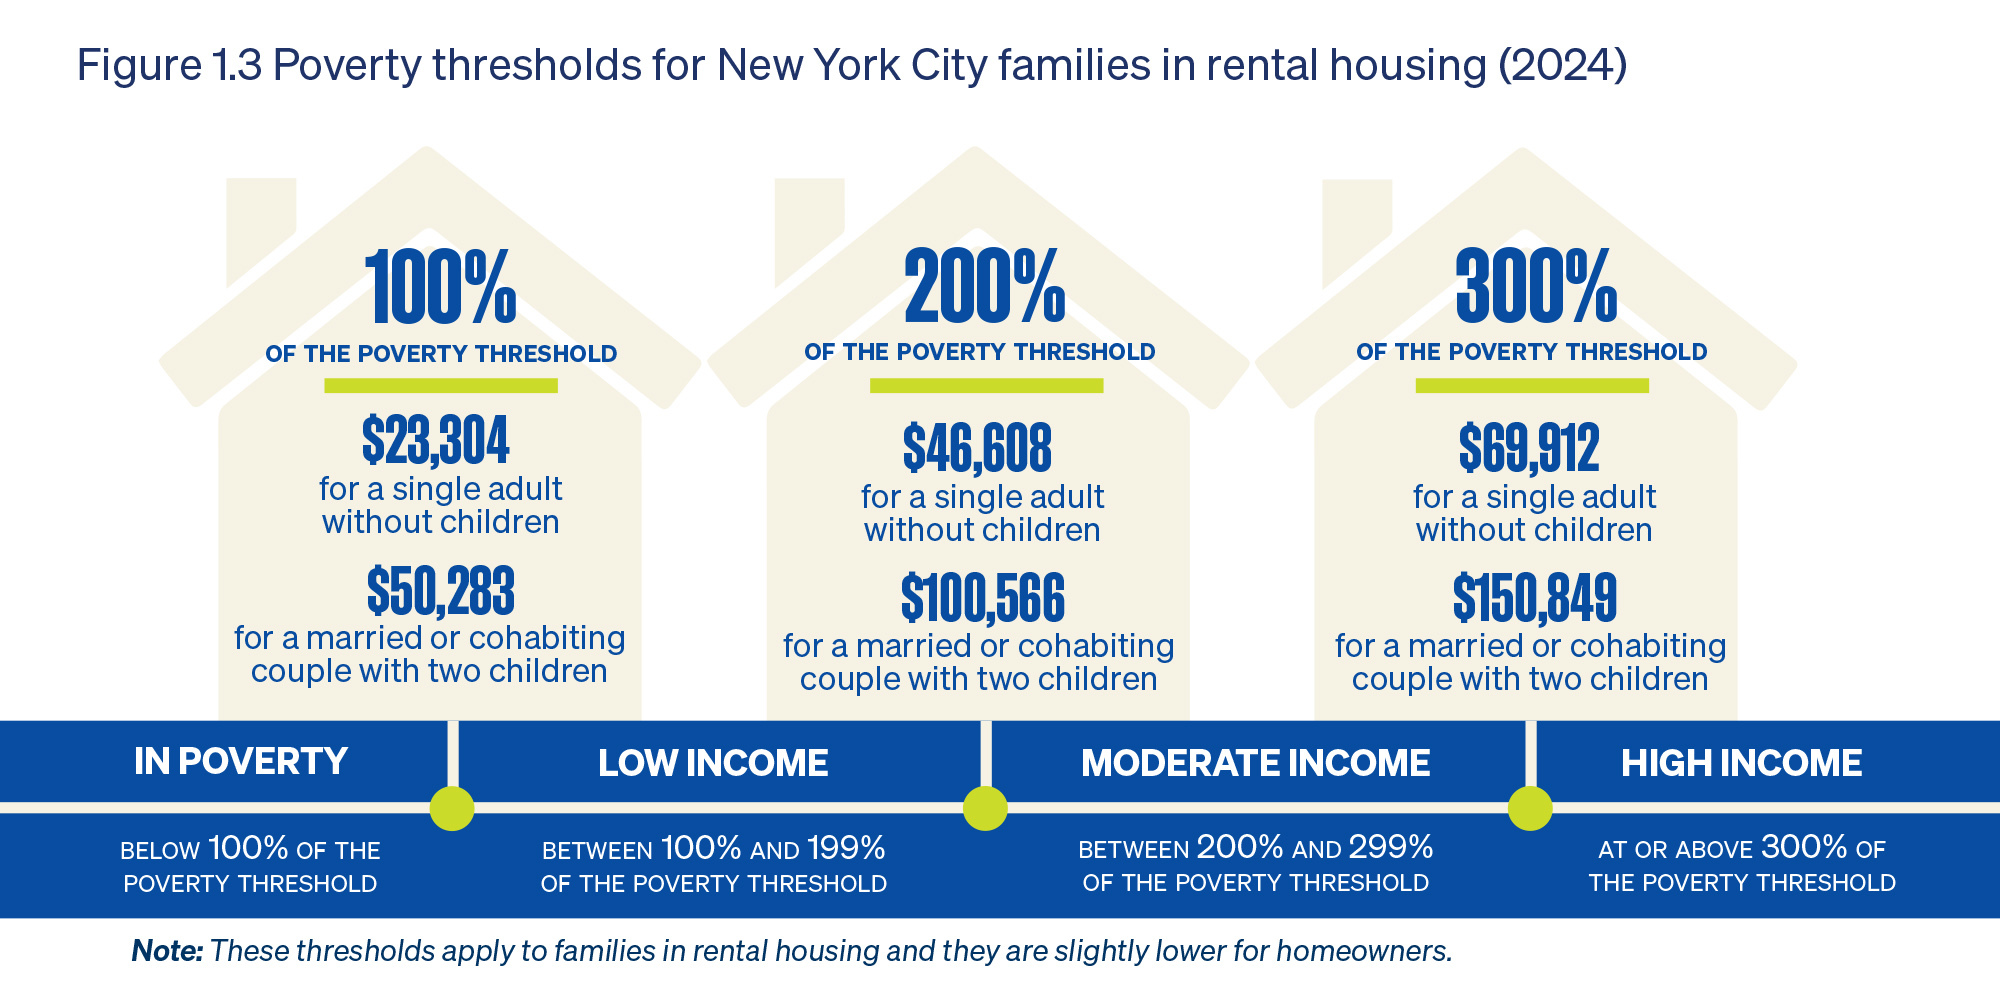
The SPM improves the measurement of poverty on all of these fronts. The SPM poverty threshold is based on contemporary spending on food, as well as on other necessities like clothing, shelter, and utilities. The poverty threshold in places like New York City is also higher given its higher-than average housing costs, and the threshold is different for renters and homeowners. In 2024, the SPM threshold for a two-adult, two-child family of renters in New York City was $50,283 (see Figure 1.3 for additional details). In the SPM, tax credits and noncash benefits are also counted as income, and for families who incur them, medical, work, and childcare costs are subtracted from income. The Poverty Tracker collects all the requisite data necessary to directly calculate the SPM in its sample of New Yorkers, and this data forms the basis of our income poverty statistics.
The Poverty Tracker measures poverty in New York City using the SPM. The New York City government also tracks trends in the city’s poverty rate using the NYCgov Poverty Measure. There are slight differences between the construction of the SPM and the NYCgov Poverty Measure, thus they produce slightly different annual poverty rates. The differences between the NYCgov Poverty Measure and the SPM are discussed in the NYCgov Poverty Measure annual report. 1
Between 2023 and 2024, overall poverty rates increased in New York City, continuing an upward trend that followed the expiration of many of the historic — but temporary — COVID-era policy interventions. By 2024, the New York City poverty rate was higher than in any year since the Poverty Tracker began measuring poverty in the city. More than 20% of New Yorkers lived in poverty each year between 2015 and 2017, but the poverty rate began to decline in both New York City and nationally in 2018 (see Figure 1.1; see the text box for discussion of the Poverty Tracker’s income poverty measure). As previous reports have shown, the poverty rate did not increase significantly in 2020 and 2021 amid the economic challenges brought on by the COVID-19 pandemic. This rise was stalled by government policies that boosted incomes in these years and actually led to relatively stable poverty rates from 2019 to 2021. Despite the progress made in reducing the risk of poverty in 2020 and 2021, the New York City and national poverty rates increased significantly in 2022 after the expiration of historic — but temporary — policy reforms at the end of 2021, and the city’s poverty rate has continued to rise since then. More than 1 in 4 (26%) New Yorkers lived in poverty in 2024, up from 25% the year prior, and the New York City poverty rate in 2024 was twice the national rate (13%).
In 2024, 25% of adult New Yorkers and 27% of children in New York City lived in poverty, and the poverty rate of both adults and children remained above pre-pandemic levels (Figure 1.2). While the city’s overall poverty rate rose between 2023 and 2024 (Figure 1.1), this increase is not evident in the rounded estimates presented in Figure 1.2. However, underlying estimates show that the rise in the overall poverty rate between 2023 and 2024 was driven by an increase in the poverty rate among adults in the city. Figure 1.2 also shows that the adult and child poverty rates in New York City have persistently been higher than the national rates.
Table 1.1 reports the number of New Yorkers kept out of poverty by government transfers and tax credits in 2023 and 2024. The results show government transfer and tax credits kept more than half a million adults and more than 300,000 children above the poverty line in 2024. 2 These findings point to the critical role that policies play in keeping New Yorkers out of poverty, but also pale in comparison to what was achieved in 2021 when such policies kept 1.5 million adults and children in the city above the poverty line. 3
In the coming years, policy expansions instituted by Governor Hochul, including the meaningful expansion of the New York State Empire State Child Credit (ESCC), will further reduce the risk of poverty among New York City children and families. By tax year 2026 4 , the ESCC will have increased from a maximum of $330 for children under age 17 to $1,000 for children under age 4 and $500 for children ages 4 to 16. Critically, the credit will no longer phase in with income, meaning that children in lower- and moderate-income families will, for the first time, be eligible for the full credit. Previous analyses found that this expansion could cut the New York City child poverty rate by more than 5%. 5 While this expansion marks an important step in the state’s goal to reduce the child poverty rate by half, 6 its progress will be meaningfully undercut by the contraction of federal safety net policies, such as SNAP and Medicaid (further explored in the Spotlight in Section 4 of this report).
How do we evaluate the effects of government policy on poverty rates?
The Poverty Tracker measures poverty in New York City using the SPM — an improved measure to the official poverty measure that allows us to isolate the impact that various policies have on the poverty rate. We assess the impact of government policy on poverty by identifying how many New Yorkers would be living in poverty when we do not include tax credits and government transfers as part of their income 7 , and then again when we do include these income sources. The former gives us the “poverty rate before tax credits and government transfers” and the latter gives us the “poverty rate” as it is commonly reported. For brevity, we refer to the poverty rate before tax credits and government transfers as the “pre-tax credit/transfer poverty rate.” The difference between these two rates translates to the impact of government policies on the poverty rate.
What policies, tax credits, and government transfers are counted when evaluating the effect of government policy on the poverty rate?
The results in Table 1.1 account for the role that the following government transfers and tax credits played in reducing the poverty rate in 2023 and 2024.
CASH TRANSFERS: Income from the Supplemental Security Income program, Unemployment Insurance, and the Temporary Assistance to Needy Families (TANF) program.
HOUSING SUBSIDIES: Government housing assistance and rent regulations (rent control and rent stabilization).
NUTRITION PROGRAMS: Benefits from the Supplemental Nutrition Assistance Program (SNAP), the Special Supplemental Nutrition Assistance Program for Women, Infants, and Children (WIC), and free- and reduced-price school lunches. 8 TAX CREDITS: The Earned Income Tax Credit and the Child Tax Credit (both federal and state).
Nearly 60% of New Yorkers lived below 200% of the poverty threshold in 2024, which translates to $46,608 for single adults and $100,566 for a married or cohabitating couple with two children (in rental housing).
The poverty line presents an estimate of how much income a family needs to meet their basic needs. As such, it is a very low threshold — $50,283 for a family of four living in rental housing in New York City in 2024 (Figure 1.3). However, it should be noted that having an annual income above this threshold is no guarantee that families will be able to meet their basic needs or will be shielded from experiences of material hardship. Those just above the poverty threshold — between 100% and 200% — are defined in the research literature as “low-income” 9 and their experiences of material hardship are often quite similar to those living below the
poverty threshold (which we explore further in Section 3 of this report).
Approximately 1 in 3 (33%) New Yorkers fell into the category of “low-income” in 2024, and combined with those living below the poverty line, this amounts 59% of the city’s population, or nearly 5 million New Yorkers who were either low-income or in poverty (Figure 1.4). Over two-thirds of the city’s children (69%), or roughly 1.1 million children, lived in families that were either low-income or in poverty.
MATERIAL HARDSHIP IN NEW YORK CITY
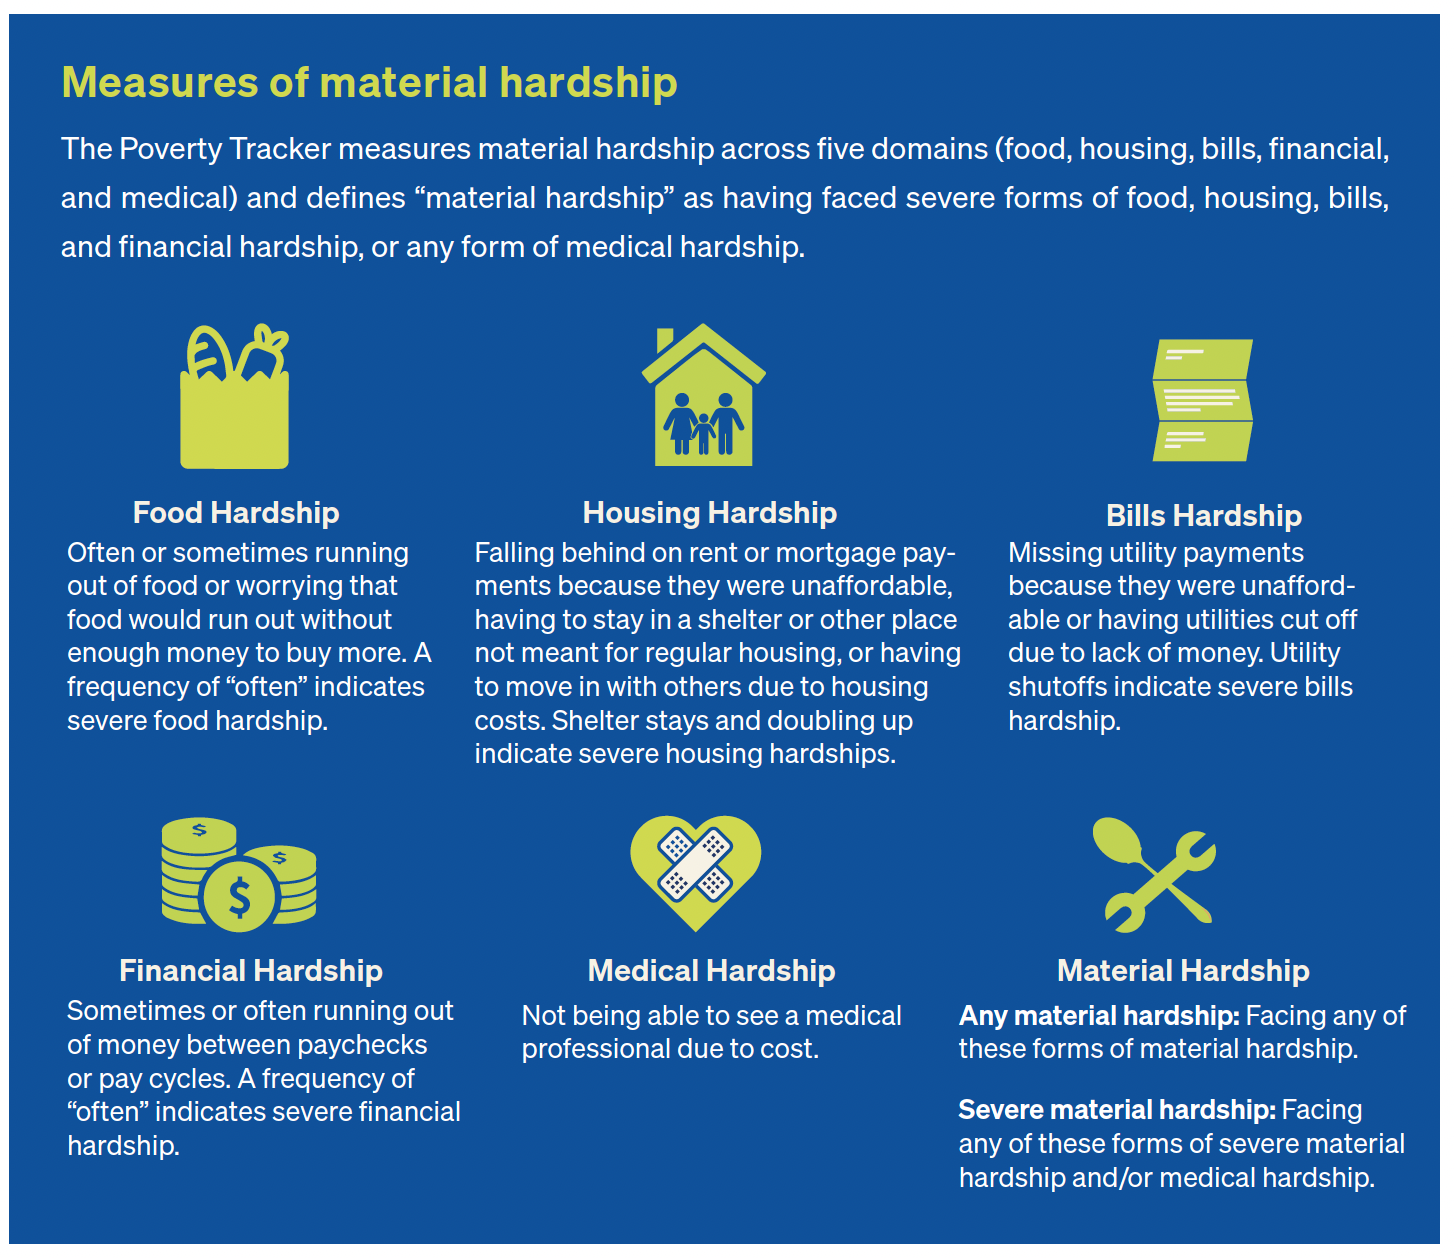
The Poverty Tracker collects measures of economic disadvantage beyond income poverty, including information on a comprehensive set of material hardships, which capture individuals’ ability to meet basic needs (see text box for a definition). Since beginning to interview New Yorkers in 2012, the Poverty Tracker has measured material hardship in the city across five domains: food, finances, housing, bills, and medical. Material hardship can also vary in its severity, which differs by domain. More severe forms of hardship are generally experienced more often (rather than only sometimes) or are more acute (such as having a utility cut off versus being behind on utility payments). The text box below presents the full list of material hardships captured by the Poverty Tracker, organized by domain, and indicates the forms of hardship considered most severe. In one domain — medical hardship — the Poverty Tracker has only one hardship indicator: not being able to see a medical provider because of cost, which we consider severe along with the measures in the other domains. New Yorkers who experience any of the hardships presented in the text box are identified as facing “Any material hardship,” and those facing any of the more severe forms of hardship or medical hardship are identified as facing “Severe material hardship.”
It is not only those living below the poverty line who struggle to make ends meet: material hardship is even more widespread than poverty.
New York is a high-cost city, and many New Yorkers living above the poverty line also struggle to keep food on the table and rent paid. Across the past 10 years, roughly 25% or more adults in the city experienced severe material hardship in each year, and 50% or more New Yorkers experienced at least one form of material hardship (Figure 1.5). However, there were also year-to-year changes in the prevalence of material hardship. Between 2015 and 2019, material hardship rates declined as poverty rates fell and the consequences of the Great Recession receded. In 2020, however, material hardship rates rose (particularly for adults) as a result of the pandemic, but then fell in 2021 as pandemic-related benefits were delivered. With the rollback of these pandemic-era policies, the prevalence of material hardships rose between 2021 and 2022, but then fell again in 2023. As discussed in last year’s annual report on the state of poverty and disadvantage in the city, the decline in hardship between 2022 and 2023 was largely explained by reduced material hardship among New Yorkers living above the poverty line.
In 2024, more than 1 in 4 adults faced severe material hardship (26%), and more than half experienced at least one form of hardship (51%). More than a quarter of children (27%) were in families that faced severe material hardship, and more than half of children (59%) were in families that faced any material hardship. This marks an increase in severe material hardship between 2023 and 2024 for adults, but a decline for children. The decrease in the share of children in families experiencing severe material hardship is concentrated among those living above the poverty line — see Appendix Figure B.2. Many New Yorkers also experience multiple forms of material hardship, which is examined in Appendix Figure B.3.
Figure 1.6 examines the prevalence of the different forms of hardship among adult New Yorkers in 2023 and 2024. While changes between 2023 and 2024 are modest, it is notable that there were increases in hardship across multiple domains, including in the share of New Yorkers missing rental payments because they did not have enough money, experiencing utility shutoffs because they could not afford utility bills, and often running out of money before the end of the month or between paychecks.
HEALTH AND MENTAL HEALTH IN NEW YORK CITY
Health challenges, such as work-limiting health conditions and psychological distress, are tied to experiences of material hardship and poverty, as they can limit one’s ability to secure income and can be costly. In this section, we examine the prevalence of health problems, which include poor self-rated health, work-limiting health conditions, and psychological distress.
Measuring health problems
The Poverty Tracker asks New Yorkers to self-rate their health and if they have any work-limiting health conditions. Respondents also complete the Kessler-6 scale, which evaluates psychological distress. Responses to these questions are used to measure health problems.
- Poor health: Respondents answered “poor” when asked to rate their health on a five-point scale from excellent to poor.
- Work-limiting health condition: Respondents indicated they had a work-limiting health condition when asked.
- Health problems: Having a work-limiting health condition or self-reporting one’s health as “poor.”
- Serious psychological distress: Identified as having serious psychological distress according to the Kessler-6 scale. 10
In 2024, 1 in 5 adult New Yorkers faced a health problem, defined as reporting poor health or having a work-limiting health condition.
In 2024, about a fifth (20%) of adult New Yorkers reported having a health problem, more than 1 in 10 (11%) experienced serious psychological distress, and more than 1 in 4 (27%) faced either a health problem or serious psychological distress (Figure 1.7). Looking at trends in these health indicators shows that the prevalence of health problems is similar to pre-pandemic levels, but the rate of serious psychological distress remains above pre-pandemic levels. We further examine the overlap between experiences of poverty, hardship, health problems, and psychological distress in Section 3 of the report.
When examining citywide rates of poverty, hardship, and health problems across the years, 2024 highlights the continued economic strains that New Yorkers have faced since the onset of the pandemic. Rates of poverty have increased since the peak years of the pandemic and are especially pronounced among children. The share of New Yorkers experiencing health problems was similar to pre-pandemic levels, though more elevated levels of psychological distress emphasize the lingering effects of the pandemic and recent economic strains. As we show in the next section, there are also substantial disparities in exposure to economic disadvantage along racial and ethnic lines and between other population subgroups. Taken together, these results point to the need for robust and long-lasting policy tools and interventions to bolster the economic security and health of New Yorkers.
Section 2: Inequities in Poverty, Material Hardship, and Health Problems
Highlights
- In 2024, economic disadvantage continued to be significantly more common among Asian, Black, and Latino New Yorkers than among white New Yorkers, pointing to structures of inequity that reproduce economic disadvantage along racial and ethnic lines.
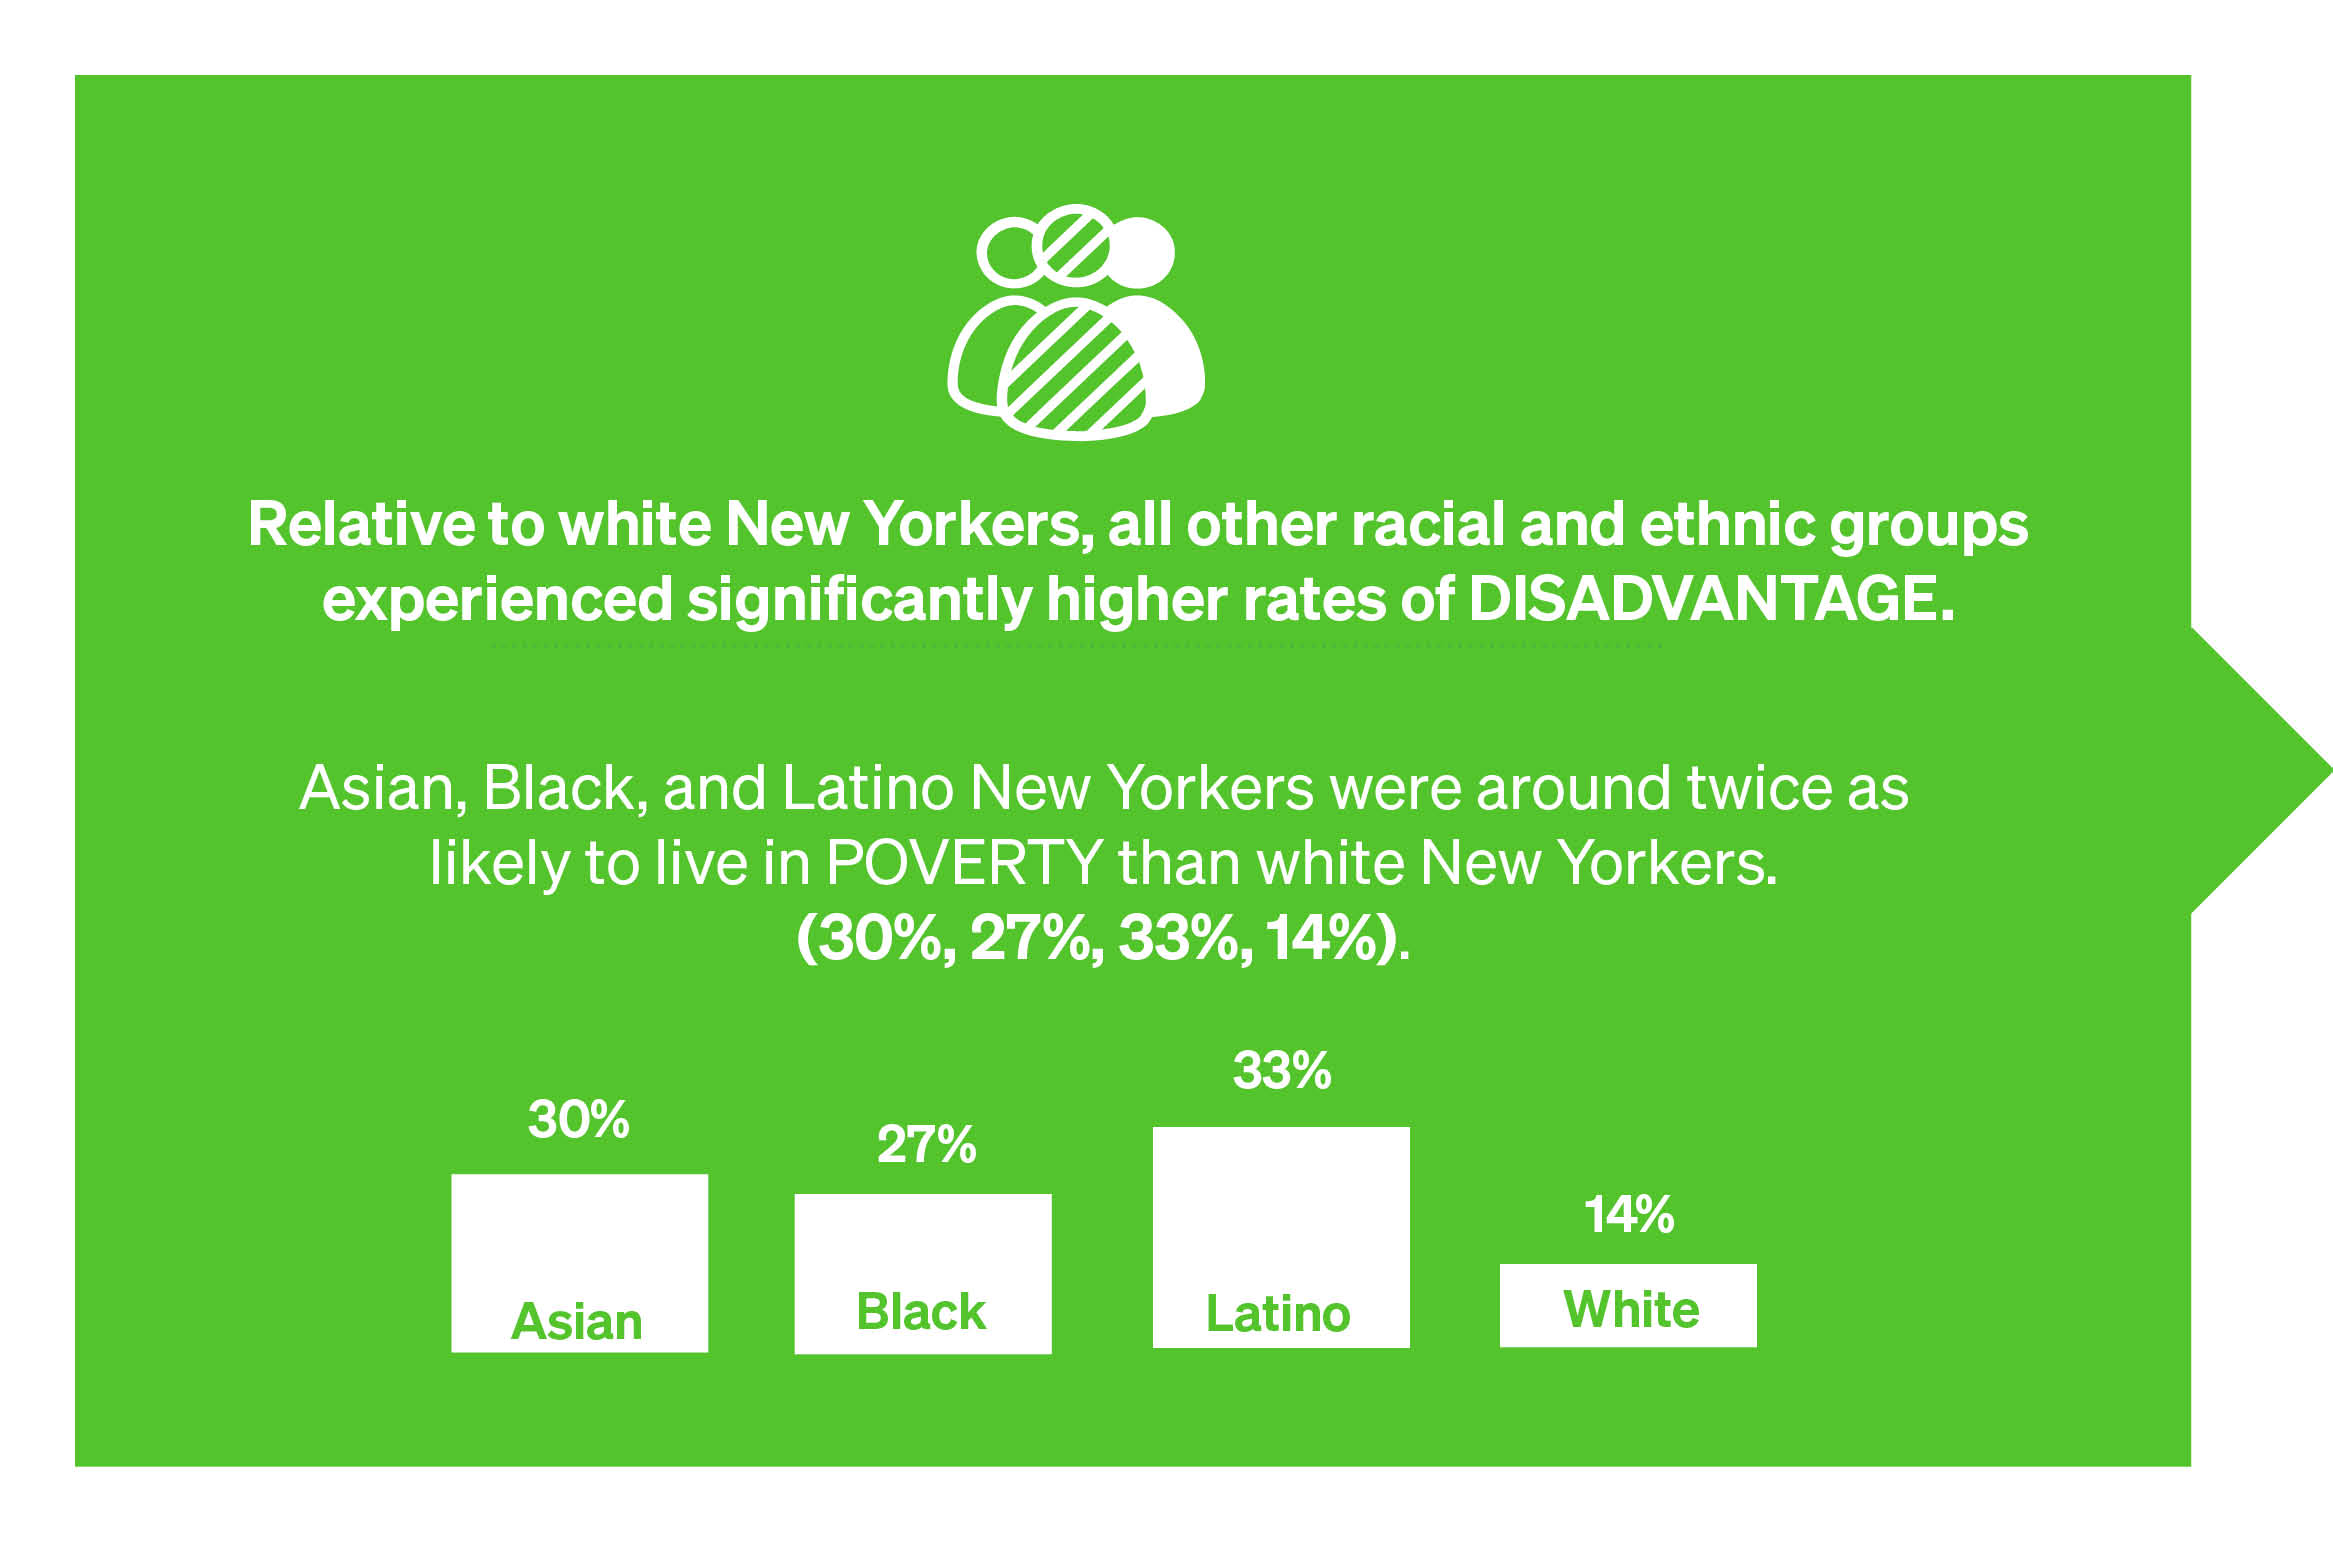
- Asian and Latino New Yorkers were twice as likely to live in poverty compared to white New Yorkers (30% and 33% vs. 14%), and rates were similarly elevated among Black New Yorkers (27%). These gaps were wider in 2024 than in years prior.
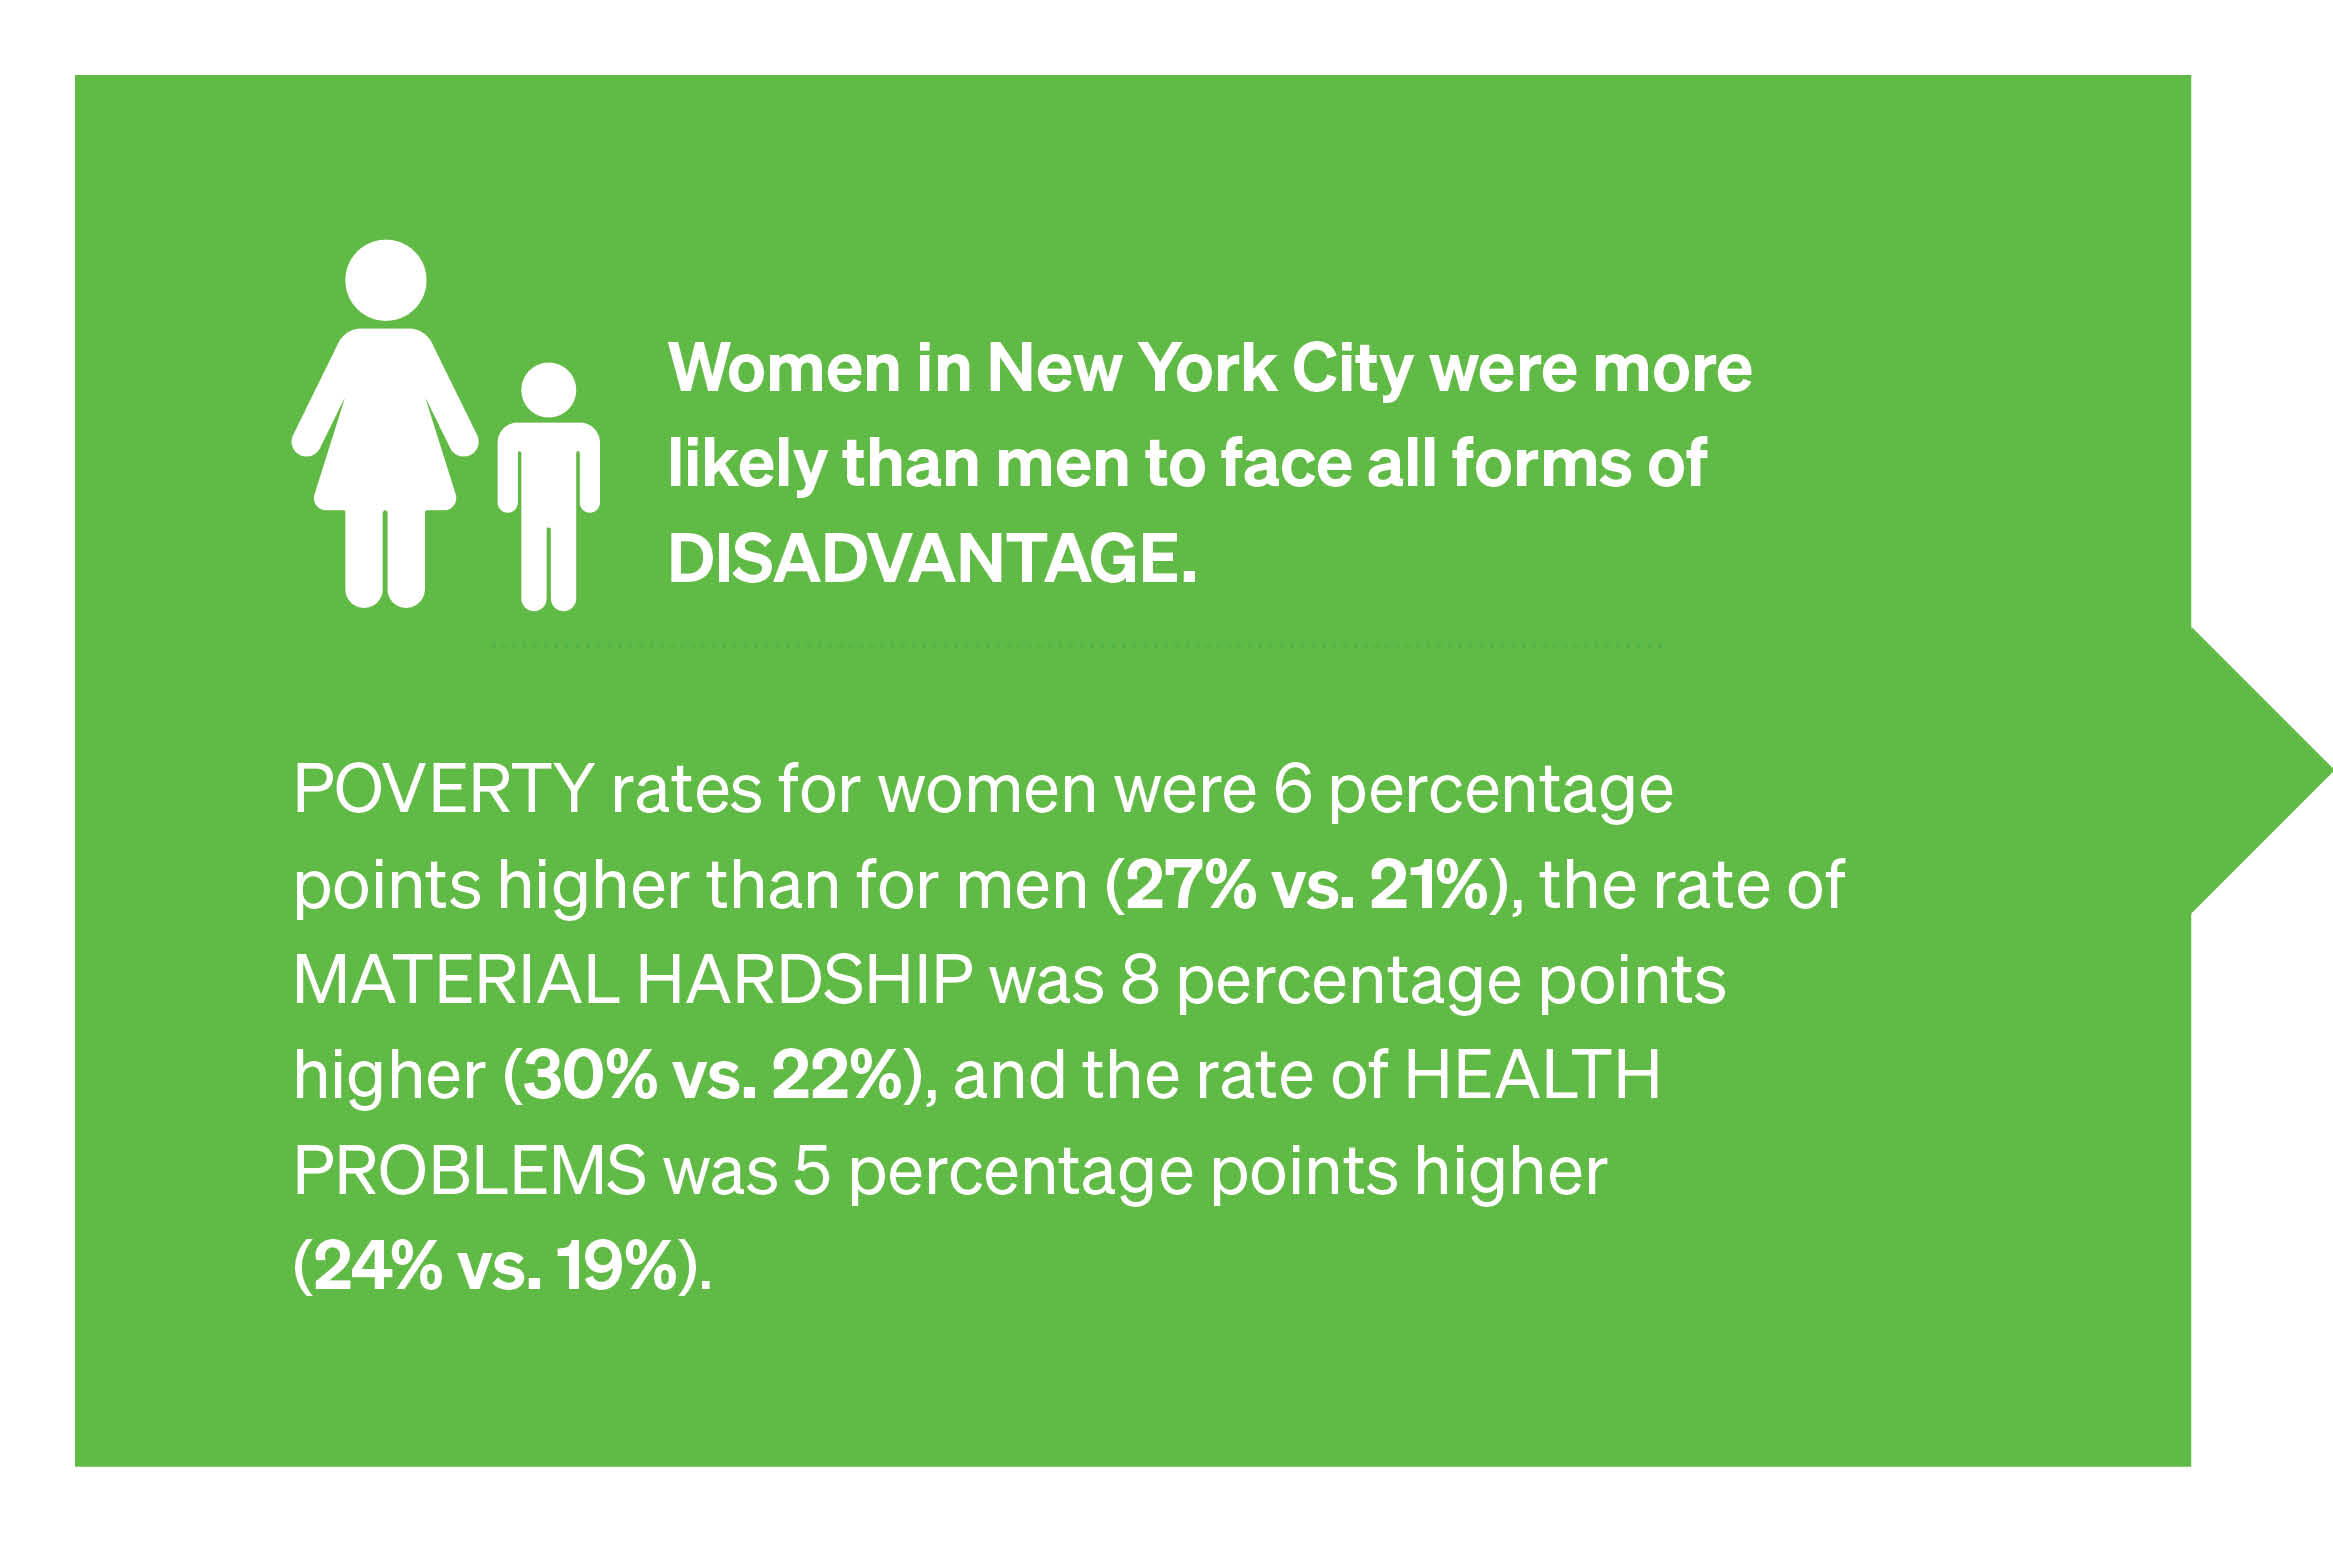
- Women in New York City experienced higher rates of all forms of disadvantage than men.
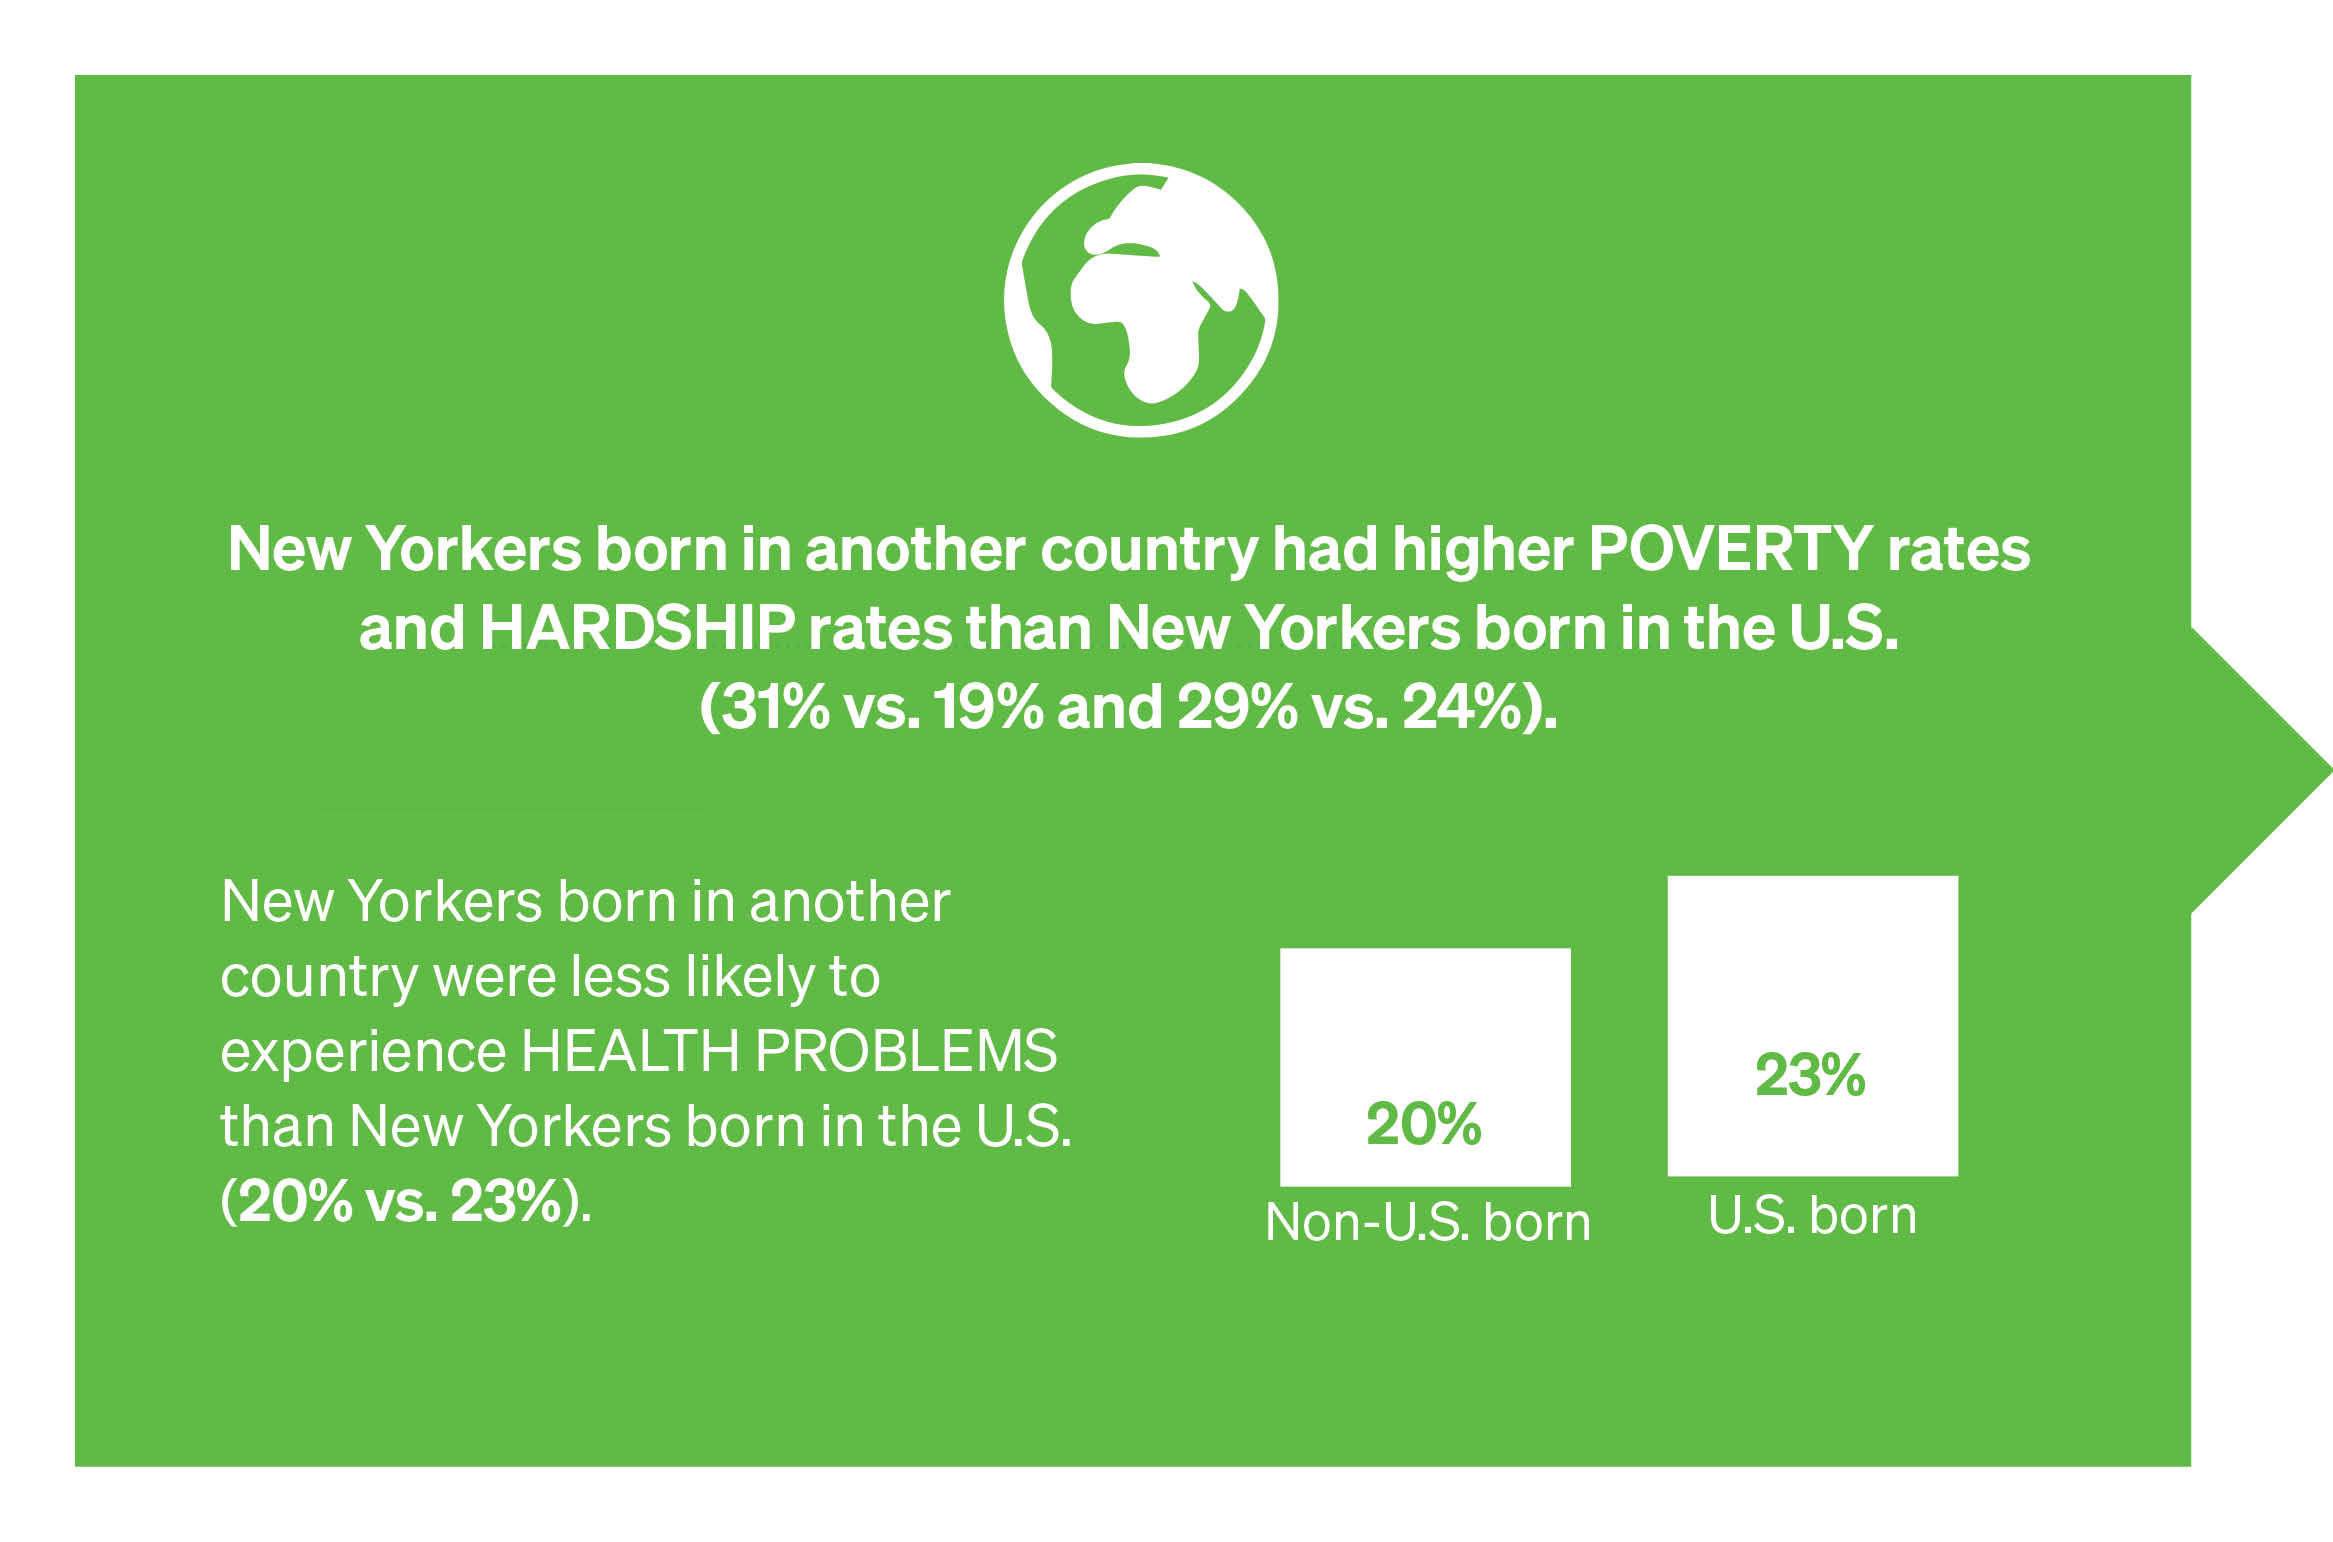
- New Yorkers born outside of the U.S. also faced higher rates of poverty than U.S.-born residents, but a lower prevalence of health problems.
- Differences in the levels of disadvantage among New Yorkers were also present by borough, with experiences of all forms of disadvantage being highest in the Bronx.
It is well known that: (1) poverty, material hardship, and health problems are not equally distributed across demographic groups and (2) policy plays a role in creating and mitigating inequities. For example, racially discriminatory employment policy, housing policy, and criminal justice policy — to name just a few domains — are known to compromise the economic security of people of color, and Black individuals in particular. In addition, immigration policy affects the economic stability of non-citizens and their families. Unpaid family leave and sick leave policy — a challenge that New York City and New York State have taken on — are also known to play into gender pay gaps that result from taking maternity leave and caring for children.
Disproportionate transportation investment in Manhattan versus other boroughs has also introduced variation in access to economic opportunity within the city. These are just some examples of the ways that policy can creates economic inequities, but as we have highlighted in this report, policy also plays a critical role in reducing economic disadvantage.
In Figure 2.1, we document inequities in rates of poverty, hardship, and health problems in 2024 across racial and ethnic groups. 11 While the Poverty Tracker does collect data on individuals who identify as multiracial or a race or ethnicity other than Asian, Black, Latino, and white, we are unable to reliably produce robust year-to-year estimates for these groups due to sample size constraints. This points to the fact that certain racial inequities can go unnoticed due to barriers to collecting data (e.g., disparities that affect the American Indian or Alaska Native (AIAN) populations, who face high levels of poverty at the national level). 12
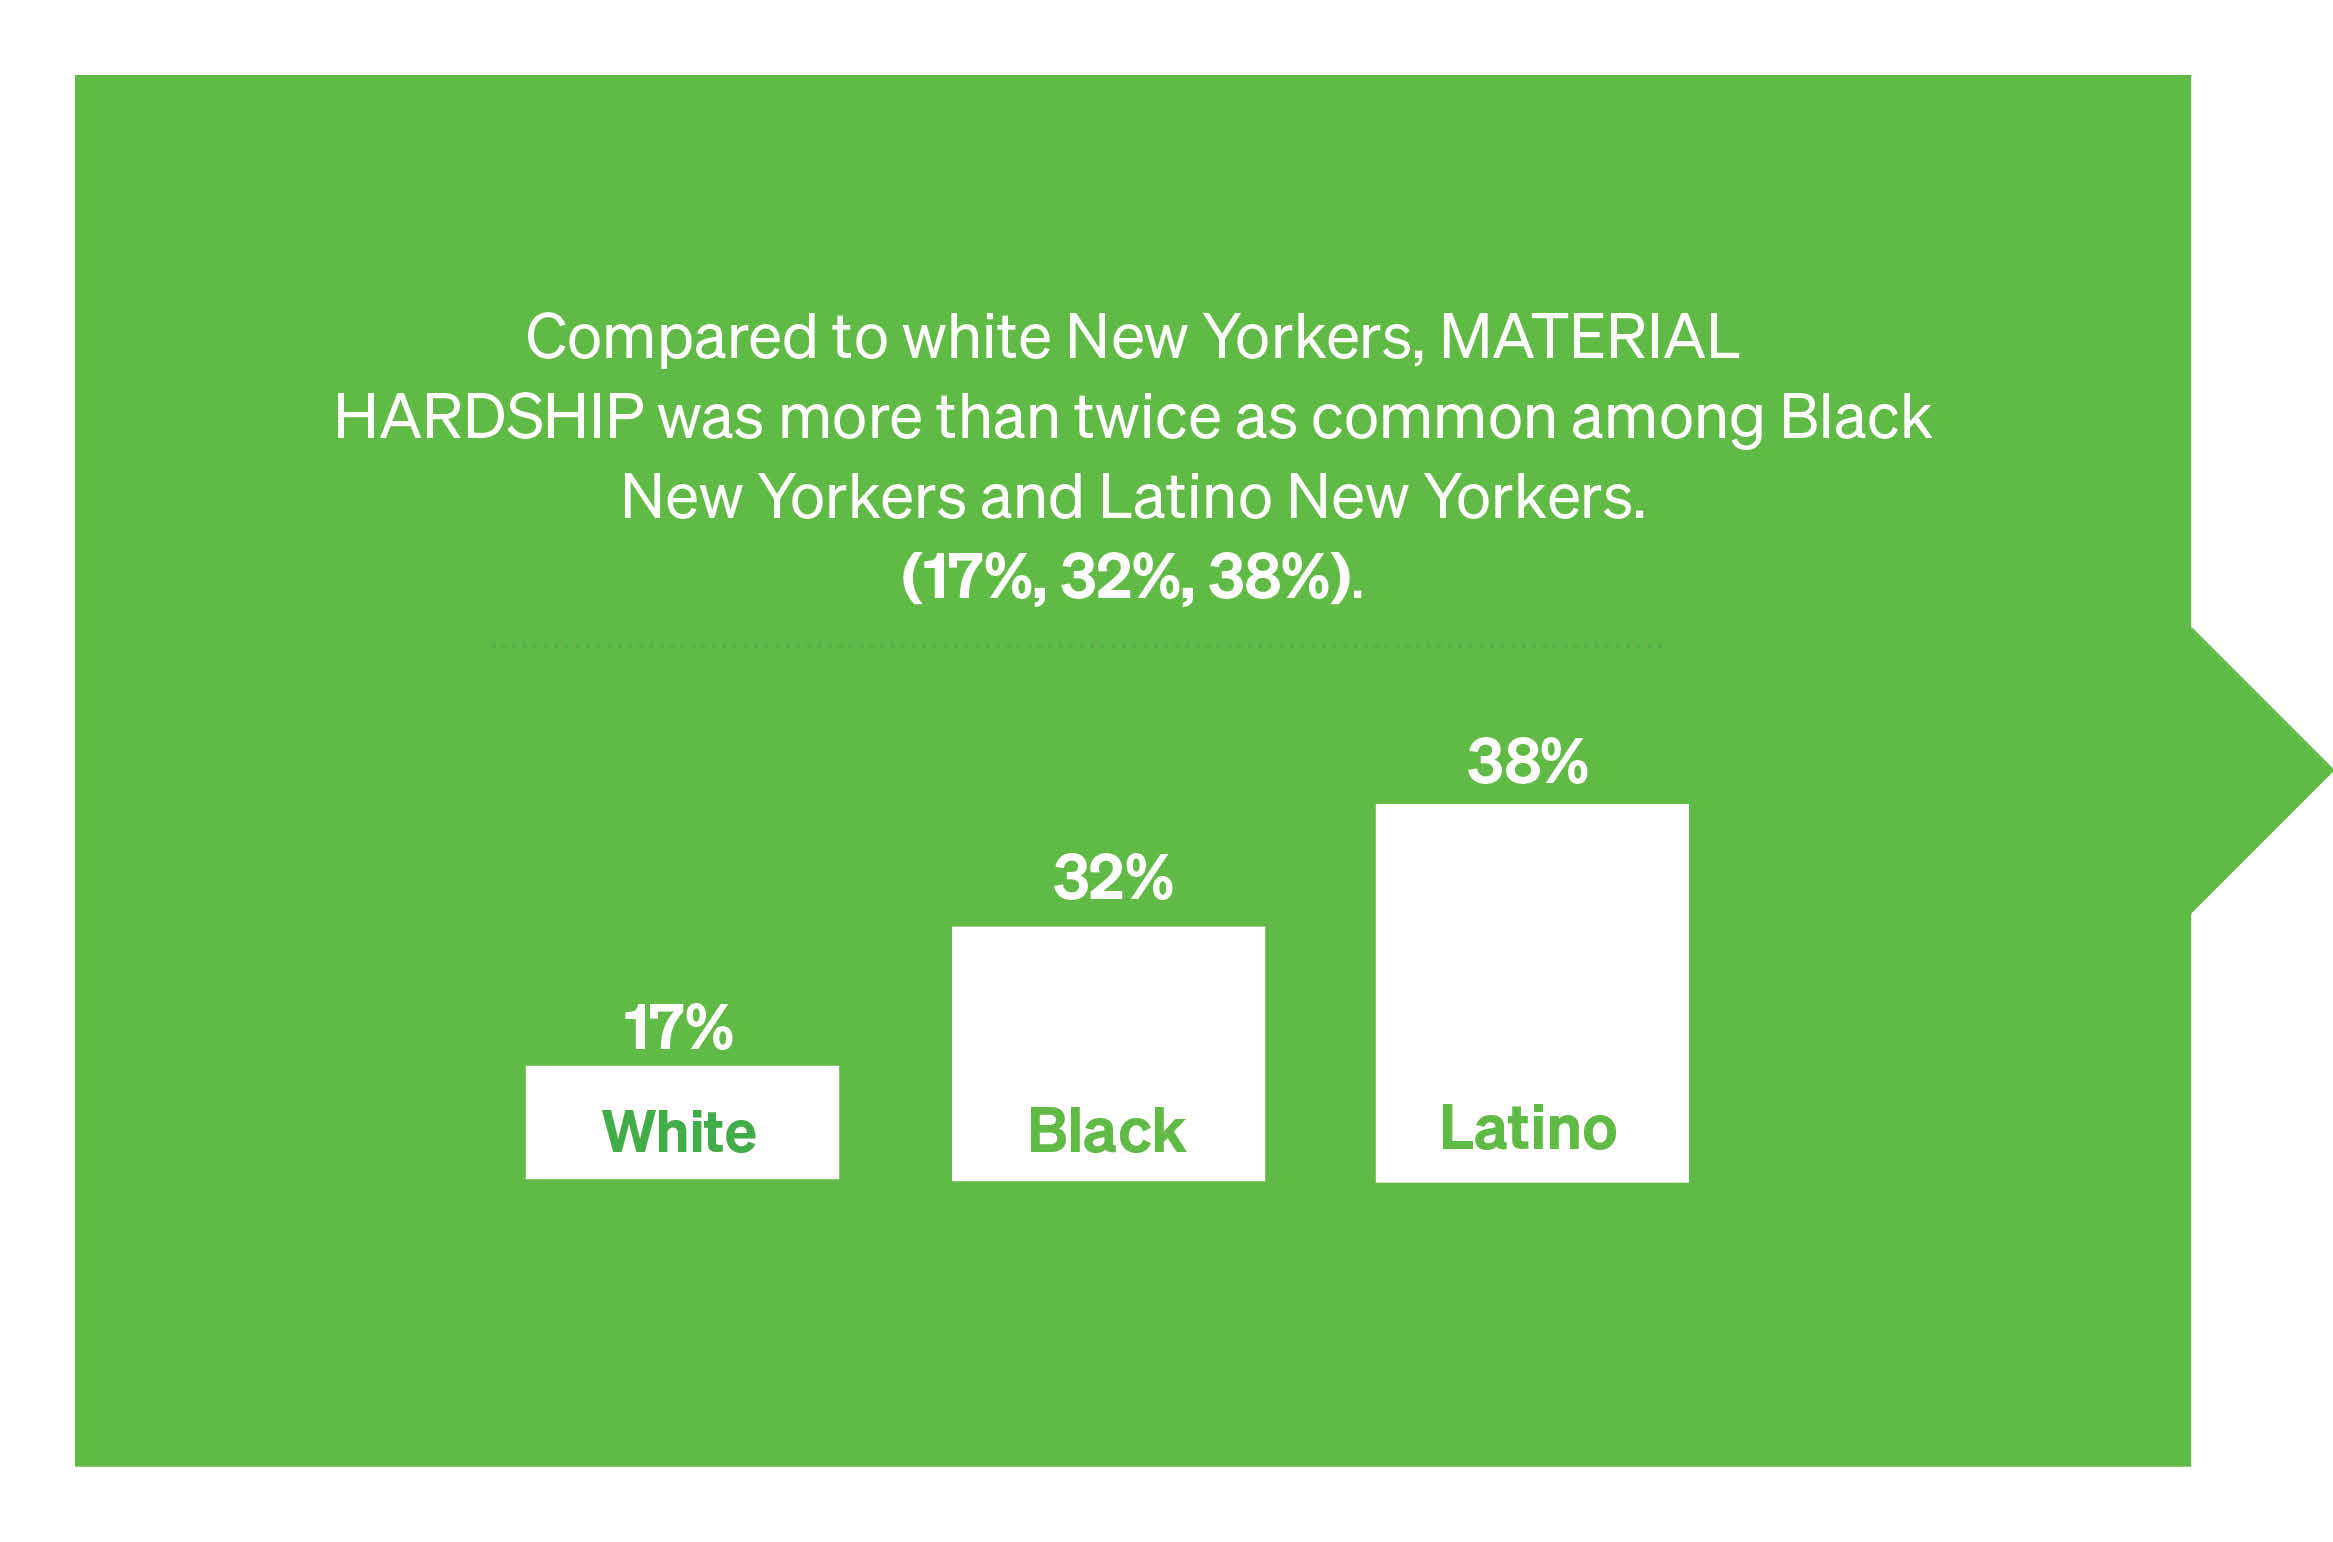
In 2024, disadvantage was significantly more common among Asian, Black, and Latino New Yorkers than among white New Yorkers, pointing to structures of inequity that reproduce disadvantage along racial and ethnic lines. Asian and Latino New Yorkers were more than twice as likely to live in poverty compared to white New Yorkers (30% and 33% vs. 14%), and rates were similarly elevated among Black New Yorkers (27%). These gaps in poverty rates are also wider than the year prior. 13 Beyond poverty, in 2024, Latino New Yorkers faced a strikingly high rate of severe material hardship: 38%. Severe material hardship was also more prevalent among Black and Asian New Yorkers than white New Yorkers, though rates for Asian New Yorkers were more muted (32%, 19%, and 16%, respectively). In terms of health, white and Asian New Yorkers had a more similar prevalence of health problems, 18% and 13%, respectively, but like other measures of disadvantage, health problems were more prevalent among Black New Yorkers and Latino New Yorkers, at 28% and 27%, respectively. Among other factors, varying rates of health problems can be attributed to environmental and/or work conditions that vary by racial and ethnic groups. 14
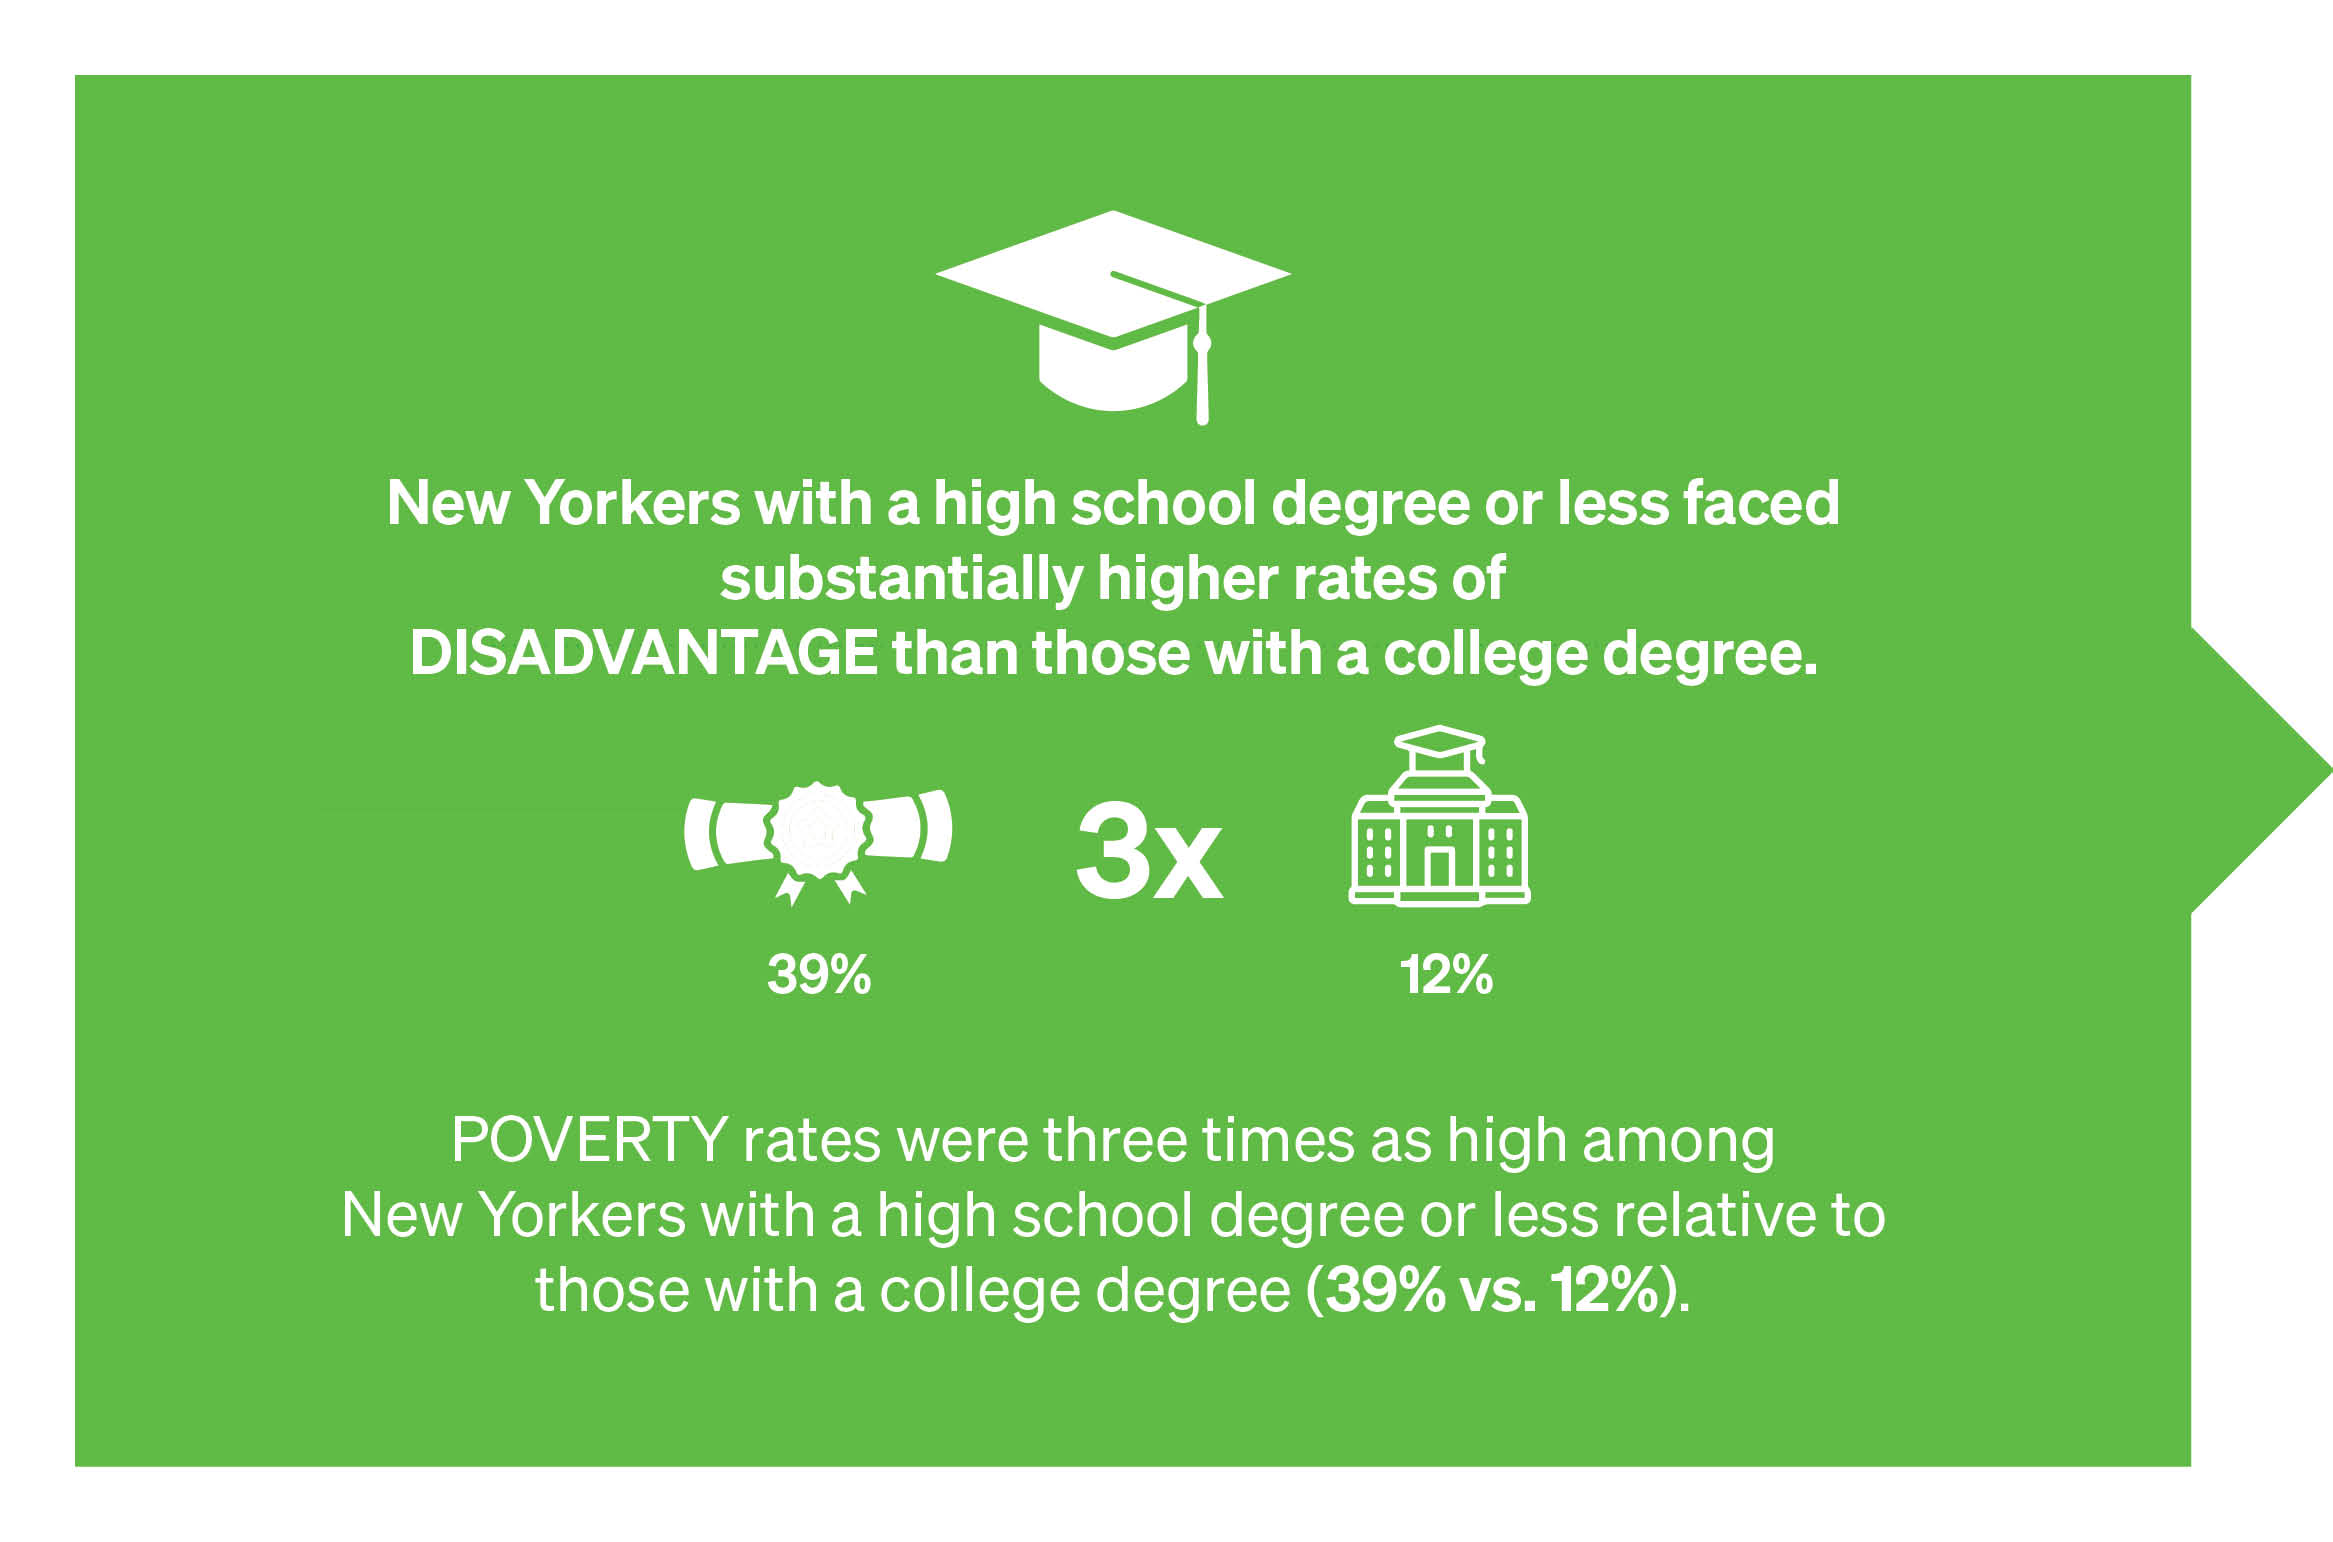
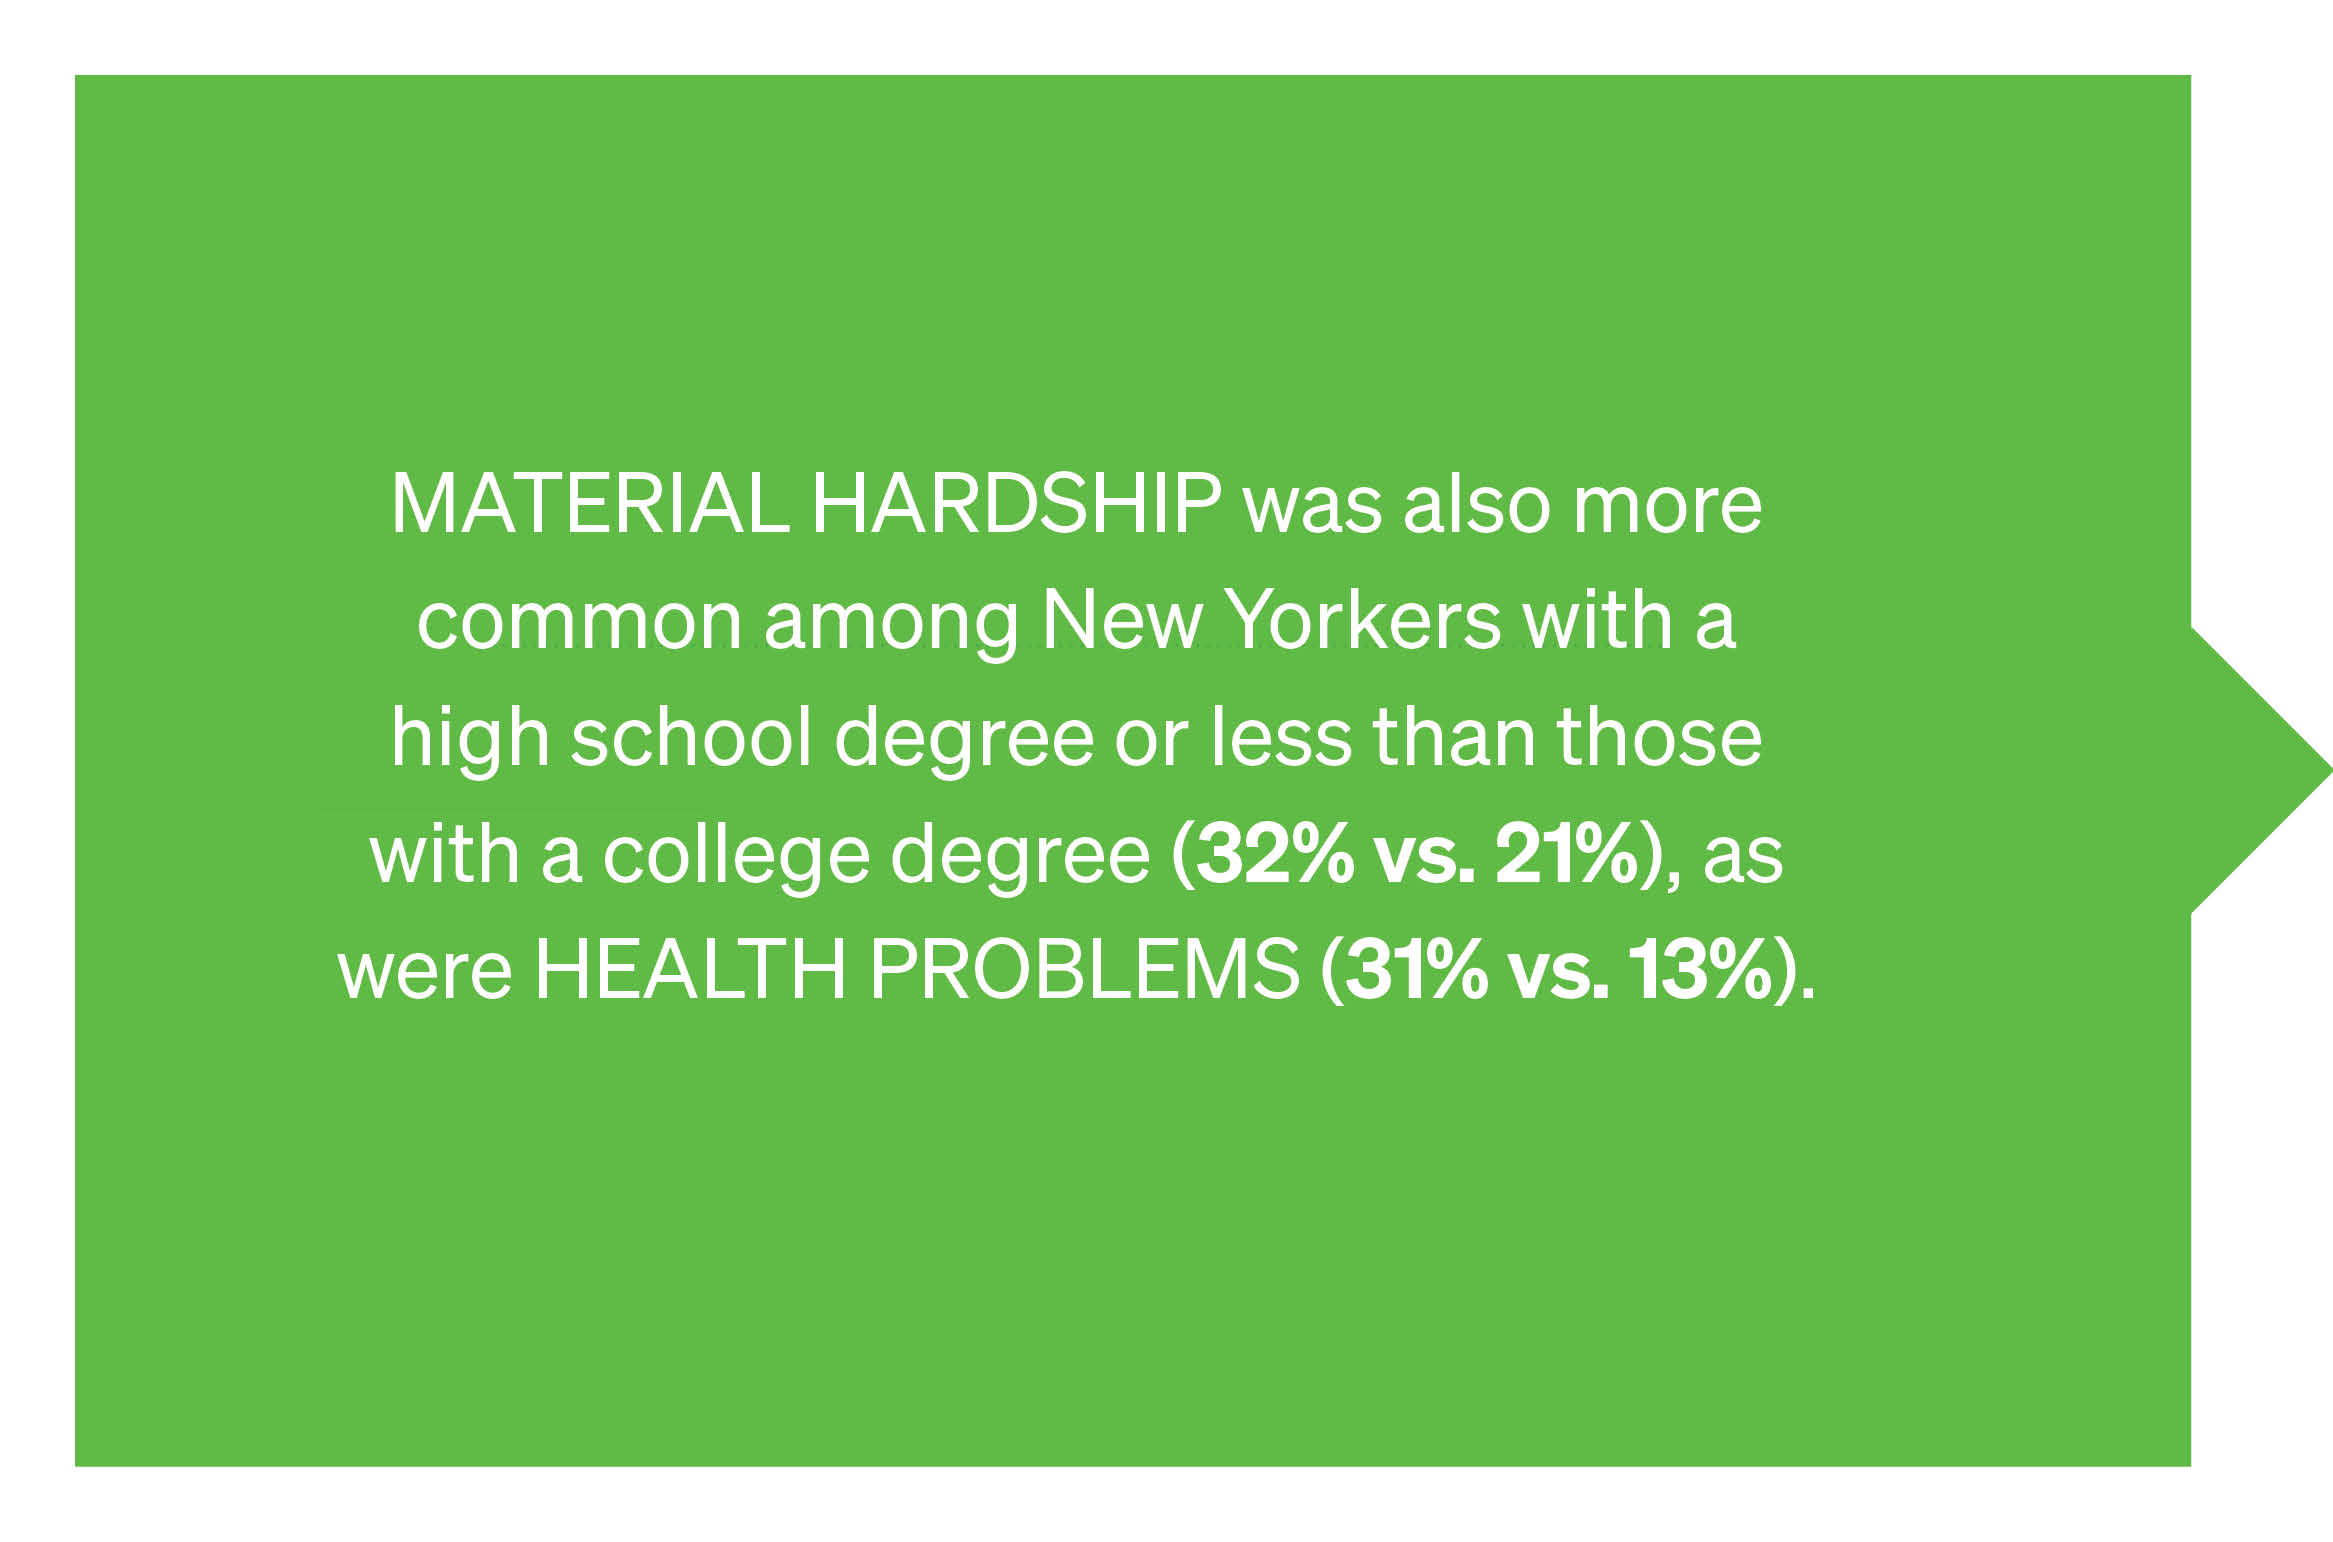
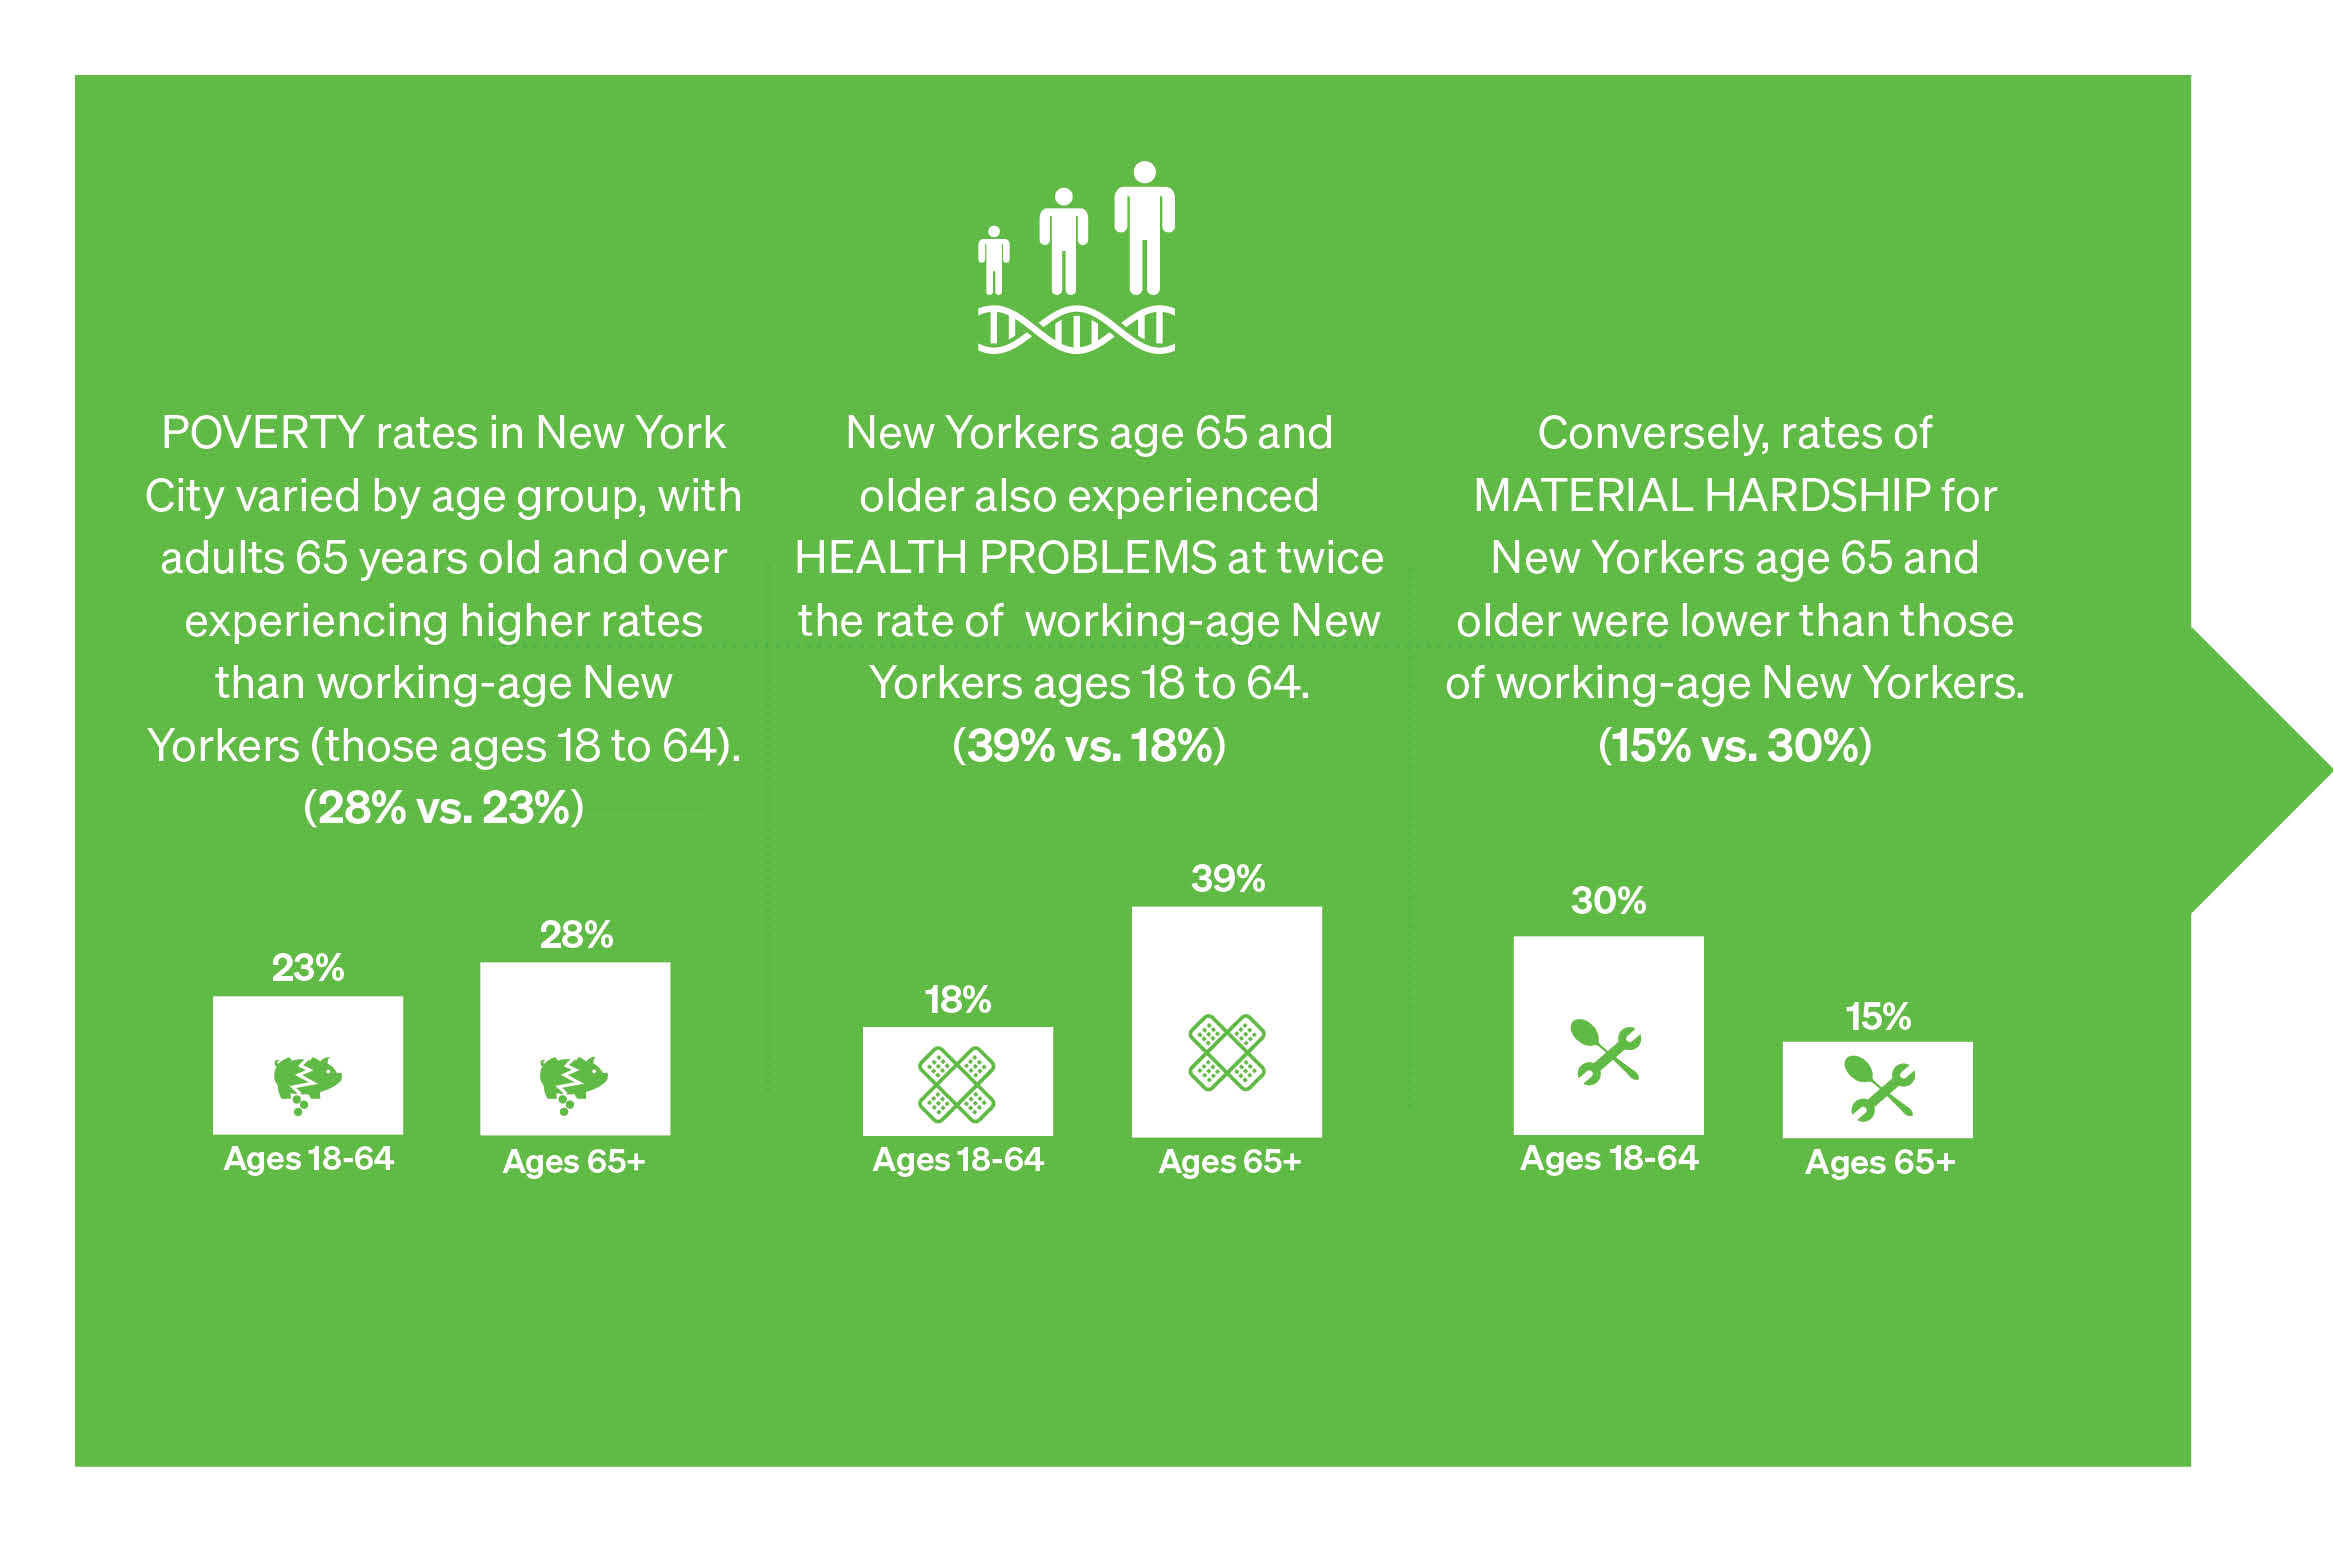
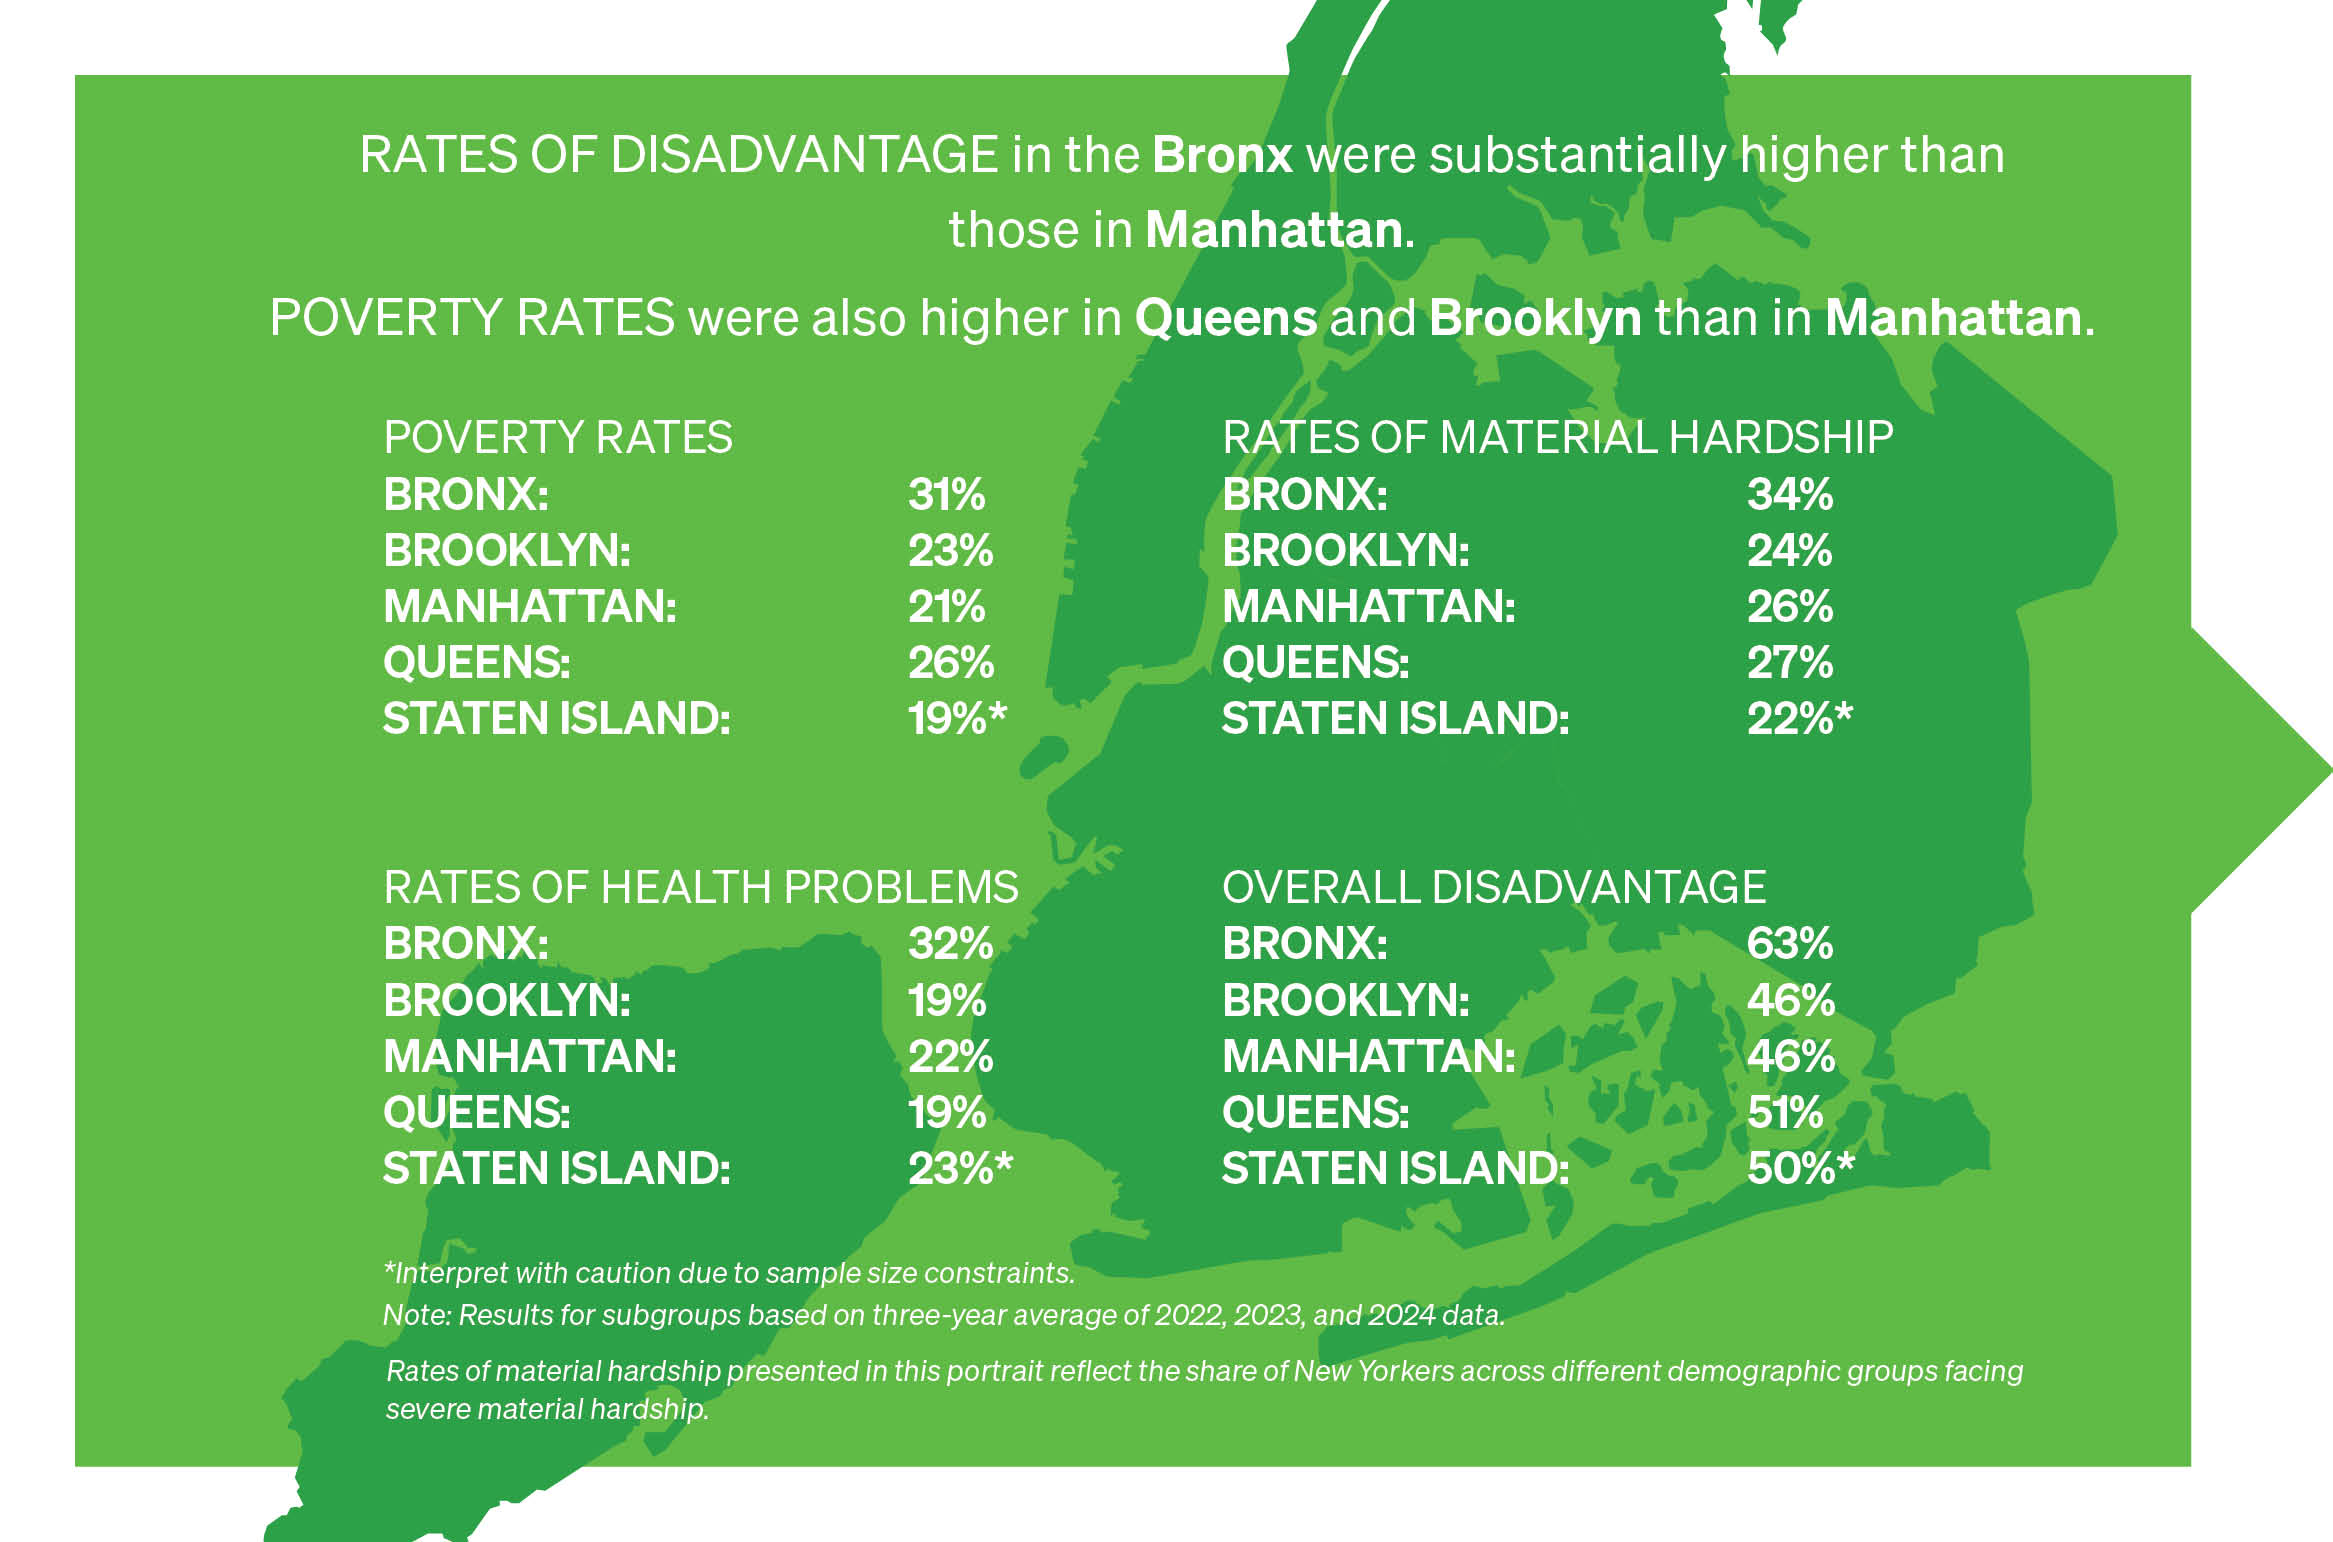
The portrait of disadvantage in 2024 (presented in the below carousel) highlights other inequities in economic disadvantage across demographic groups. For example, women in New York City experience higher rates of all forms of disadvantage than men, and histories of sex- and gender-based income and social inequality may provide some explanation for the significant differences in these rates. 15 New Yorkers born outside of the U.S. also face higher rates of poverty and hardship than U.S.-born residents, but a lower prevalence of health problems. This may be attributed to the immigrant health paradox, an observed phenomenon of better health among immigrants (compared to non-immigrants) upon their arrival to a new country. 16 There is also substantial variation in poverty, hardship, and health problems by educational attainment, and New Yorkers with a high school degree or less are significantly more likely to face all of these forms of disadvantage than New Yorkers with a college degree. Rates of economic disadvantage also vary by age. Expectedly, New Yorkers age 65 and over have a higher prevalence of health problems than working-age New Yorkers ages 18-64 (39% vs. 18%). Poverty rates are also higher among New Yorkers over age 65 compared to working-age New Yorkers (28% vs. 23%), though material hardship is more common among working-age New Yorkers than those age 65 and older (30% vs. 15%). Differences in the levels of disadvantage among New Yorkers are also present across boroughs. The poverty rate is highest in the Bronx (31%), although Queens (26%) and Brooklyn (23%) also experience higher rates of poverty than Manhattan (21%). Similarly, residents of the Bronx experience much higher rates of severe material hardship than residents across the other boroughs, at 34%. Roughly a quarter of residents of all other borough face severe material hardship. The prevalence of health problems is also notably higher in the Bronx than in other boroughs. Nearly a third of Bronx residents (32%) experience health problems; this rate is 13 percentage points higher than that in Queens (19%) and in Brooklyn (19%), and 10 percentage points higher than that in Manhattan (22%). Though the rates of poverty, material hardship, and health problems in Staten Island are notably lower than those of the other boroughs, we note that these results should be interpreted with caution, as there is a smaller number of Staten Island residents in our sample. Overall, these results highlight how inequities will continue to persist without intentional policies to narrow — and eventually close — these long-standing gaps.
Portrait of Disadvantage in NYC in 2024
/
Section 3: Overlapping Experiences of Disadvantage in New York City
Highlights
- Half of New Yorkers faced at least one form of disadvantage (poverty, severe material hardship, or health problems) in 2024.
- Material hardship persists across the income distribution, but it is most common among those living below 200% of the poverty line.
- Work-limiting health conditions were more than twice as common among low-income New Yorkers and those in poverty versus higher-income New Yorkers.
The Poverty Tracker measures three forms of disadvantage: income poverty, severe material hardship, and health problems. Disadvantage is thus multidimensional and experiences of disadvantage are inter-related: health problems can spur income losses just as income loss can lead to forgone medical care and health problems. Focusing on singular forms of disadvantage fails to capture both the full extent of disadvantage and the relationships among different facets of disadvantages — but the Poverty Tracker is designed to capture this wider picture. In this section, we harness this comprehensive perspective and examine overlapping experiences of disadvantage in New York City.
In 2024, half (50%) of New Yorkers faced at least one form of disadvantage.
Figure 3.1 shows the share of the adult population facing any form of disadvantage (poverty, severe material hardship, or health problems) and breaks this population into the share facing one, two, or all three forms of disadvantage.
Turning to the share of adults facing one, two, or three forms of disadvantage, the results show that the share of adults facing all three forms of disadvantage was relatively small in 2024, at 5%. However, this still translates to roughly 340,000 adult New Yorkers facing all these challenges. We also find that 13% of adults faced two forms of disadvantage and nearly 1 in 3 (32%) faced one. In the following results, we dig further into the relationships between these different forms of disadvantage. We begin by analyzing the intersections between poverty, hardship, and health problems, and analyzing rates of these disadvantages across the income distribution.
MATERIAL HARDSHIP ACROSS THE INCOME DISTRIBUTION
Hardship persists across the income distribution but is most common among those living below 200% of the poverty line.
Figure 3.2 highlights the intersection between severe material hardship and poverty by showing rates of severe material hardship by income relative to the poverty line (see Figure 1.3 for more details about this income measure). Roughly 2 in 5 (38%) New Yorkers below the poverty line faced at least one form of severe hardship in 2024, as did 34% of those between 100% and 200% of the poverty line (i.e., New Yorkers with low incomes). More than 1 in 10 low-income New Yorkers and those in poverty also experience multiple severe hardships (13% and 18%, respectively), compared to 8% of those with moderate incomes and 3% of those with incomes above 300% of the poverty line.
HEALTH PROBLEMS ACROSS THE INCOME DISTRIBUTION
In 2024, work-limiting health conditions were roughly twice as common among low-income New Yorkers and those in poverty compared to higher-income New Yorkers. There is an extensive literature documenting that low-income individuals are more likely to have health problems than those with higher incomes. 17 Income is a social determinant of health, in part due to policy choices, as policies that bolster income have been found to improve people’s health. 18 Poverty Tracker data show that in New York City, these health disparities by income are significant: 30% of New Yorkers in poverty and 22% of low-income New Yorkers endured work-limiting health conditions in 2024 compared to 16% of moderate-income and 10% of higher-income New Yorkers (Figure 3.3). While less common than work-limiting health conditions, rates of poor health are also elevated among low-income New Yorkers (4%) and those in poverty (6%), compared to those with moderate or higher incomes (3% and 1%, respectively). Poverty Tracker data also show that serious psychological distress varies across the income distribution. Approximately 15% of New Yorkers in poverty experience serious psychological distress, along with 12% and 10% of those with low or moderate incomes, respectively (Figure 3.3). It is, however, less common among the highest-income New Yorkers (7%). Overall, psychological distress affects New Yorkers across the city but is most acute among those struggling most to makes ends meet in a high-cost environment.
Section 4: Spotlight Report- SNAP recipients in NYC and the consequences of federal cuts

CONCLUSION
This report examines the state of poverty and disadvantage among New Yorkers in 2024. Poverty Tracker data shows that, in 2024, more than 1 in 4 New Yorkers (26%) lived in poverty — the highest rates since we began collecting data in 2012. When looking at the population that lived below 200% of the poverty line, these numbers were even higher, with over half of adults (56%) and over two in three children (69%) considered low-income. This is especially relevant because economic difficulty was not just limited to the domain of poverty; material hardship was more common than poverty in 2024. Half of adults and children were in families that experienced at least some form of material hardship in 2024, and roughly a quarter were in families that experienced at least on form of severe material hardship. In regards to health, 1 in 5 (20%) New Yorkers reported a health problem, such as a work-limiting health condition, and more than 1 in 4 (27%) experienced either a health problem or severe psychological distress. Altogether, half of New Yorkers (50%) experienced at least one form of disadvantage: poverty, severe hardship, or health problems.
The continued prevalence of poverty and disadvantage in 2024 provides a clear example of the gaps in income that social policies can be designed to fill. While recent federal actions will narrow the impact of existing policies in coming years, there are also several opportunities at the state and local level to help offset this retrenchment. These policy options — ranging from supplementing SNAP benefits, to expanding the Housing Access Voucher Program, to funding health insurance coverage and permanently expanding the Empire State Child Tax Credit, among others — will guarantee a more secure safety net for New Yorkers, countering the consequences of recent federal action and potentially reversing the troubling rise in poverty documented in this report.
For the complete report references and appendices, click to download the report.